
UART-Rate Benchmarking of HC-05 Telemetry on an Elegoo Uno R3
After establishing a stable bidirectional HC-05 telemetry path and benchmarking it across distance and obstacle conditions at a fixed UART rate, the next engineering question was obvious: how much of the observed behavior was being set by the UART link between the HC-05 and the Uno? The Bluetooth session between the Ubuntu host and the HC-05 was only one part of the system. The module still had to relay every packet over UART to the microcontroller and receive the echoed packet back over that same serial path.
That makes UART rate an important experimental variable. A higher UART rate should reduce serialization time and improve effective throughput, but that does not automatically guarantee a better system. On an Elegoo Uno R3, the HC-05 was connected through SoftwareSerial, which means baud-rate changes are not purely an HC-05 question. They are a system integration question involving the Bluetooth module, the software UART implementation on the Uno, the packet size, and the measurement host.
This post documents that experiment in full. It describes the theory, the firmware and scripts, the test procedure, the main debugging challenges, and the results across four environments:
1 m, 3 m, 5 m, and one interior wood wall.
The UART rates tested were:
9600, 38400, 57600, and 115200
The final result was both clearer and more useful than I expected. The most important conclusion is not merely that higher UART rates are faster. The more interesting result is that 57600 emerged as the best stable operating point in this platform, while 115200 looked fast only when successful packets were isolated, but became unusable once packet loss was included in the interpretation.
What the experiment was actually testing
The full path under test was:
Ubuntu 20.04 host → Bluetooth RFCOMM / SPP → HC-05 → UART → Uno firmware → UART → HC-05 → Bluetooth RFCOMM / SPP → Ubuntu host
That matters because this is not a pure radio experiment. The benchmark measures the combined behavior of:
- the Bluetooth host connection,
- the HC-05 serial bridge,
- the UART leg between the HC-05 and the Uno,
- the Uno-side packet parser and echo logic,
- and the host-side timing and validation code.
Changing the UART rate changes only one segment of that path, but it can change the behavior of the full system dramatically.
The benchmark still used a stop-and-wait echo design. Ubuntu sent one packet, the Uno validated it and echoed it back, and Ubuntu measured the round-trip time. This design remained the right choice for the UART-rate study because it kept packet identity unambiguous and made failures easy to interpret.
The main metrics stayed the same:
Round-trip time (RTT) measured total end-to-end delay for a packet exchange.
Jitter was the standard deviation of RTT within a condition, used here as a measure of timing stability.
Packet loss captured failed or invalid echoes.
Goodput captured useful payload bytes returned per second.
Together, those metrics let the rate sweep answer a more interesting question than “which baud rate is fastest?” They let it answer:
Which UART rate produces the best combination of latency, efficiency, stability, and reliability for this specific HC-05 + Uno implementation?
Why this experiment mattered
This UART-rate experiment was useful because it separated two different kinds of performance limitation.
One possible interpretation of the earlier benchmark was that the system was primarily limited by the Bluetooth radio path. Another possible interpretation was that the system was limited by the local serial bridge, especially because the Uno was using SoftwareSerial. Without varying the UART rate, there was no clean way to distinguish between those possibilities.
That is why this experiment was worth doing. If raising the UART rate improved performance substantially while keeping reliability intact, then the UART leg was clearly a major factor. If raising the UART rate caused timing instability or packet loss, then the serial implementation itself had become the bottleneck.
In that sense, the UART-rate sweep was not just an optimization exercise. It was a way to identify where the system really started to break.
Experimental design
The design stayed intentionally controlled. The payload sizes were the same as in the previous benchmark:
1 byte, 8 bytes, 32 bytes, and 64 bytes
Each condition used 100 trials per payload size, which meant 400 packet exchanges per run.
The environmental conditions were:
1 m line-of-sight, 3 m, 5 m, and one interior wood wall
The wall was a simple wood wall inside a house. It should therefore be interpreted as a light indoor obstruction rather than a dense attenuation case such as concrete, brick, or metal.
The important thing is that only one variable changed at a time. When the experiment moved from 9600 to 38400, or from 38400 to 57600, the hardware platform, payload sizes, host code, and basic environment stayed the same.
Hardware and host setup
The hardware remained intentionally simple:
- Elegoo Uno R3
- HC-05 Bluetooth module
- breadboard and jumper wires
- voltage divider on the Uno TX → HC-05 RX path
- Ubuntu 20.04 laptop as the host
The Uno used SoftwareSerial on pins 10 and 11 instead of the main USB serial interface. That separation made the Bluetooth telemetry path easier to isolate and kept the firmware architecture consistent across all runs.
As in the earlier benchmark, the Uno TX → HC-05 RX line used a resistor divider to bring the signal closer to the HC-05 receive-level expectations. This mattered even more in the UART-rate sweep because any weakness in that physical path would show up faster as the rate increased.
The key architectural point
This is the most important conceptual point in the whole study:
Changing the HC-05 UART rate does not change the Python Bluetooth socket API on Ubuntu.
The host still connects to the HC-05 over Bluetooth RFCOMM / SPP in the same way. What changes is the local UART rate between the HC-05 and the Uno. That means the experiment does not require a different Python-side baud-rate parameter. Instead, it requires:
- reconfiguring the HC-05 in AT mode,
- updating the Uno firmware to use the same UART rate,
- verifying that the module is back in normal data mode,
- and then rerunning the same host benchmark.
That distinction ended up being essential for debugging.
The main challenges and how I resolved them
The first major challenge was a bad UART rate entry. During the experiment, I accidentally tried 34800 instead of 38400. That produced connection failures and benchmark timeouts. The symptoms were confusing at first because the Python benchmark failed at the Bluetooth socket stage, and the earlier LED/echo validation also stopped working from Ubuntu. The resolution was to go back into AT mode, restore a known valid UART setting, return the module to normal data mode, and then rerun a basic verification test before attempting the full benchmark again.
That mistake turned out to be a very useful lesson. It reinforced the fact that if the HC-05 and the Uno are no longer matched at the UART level, the Bluetooth layer may still look partly alive while the actual telemetry path is unusable.
The second recurring challenge was stale session state after configuration changes. After changing the UART setting or after repeated test runs, the benchmark would sometimes fail to connect cleanly from Ubuntu. In practice, the fastest and most reliable fix was to power-cycle the Uno and HC-05, make sure no other device was connected to the module, and then reconnect from the Python benchmark script. That worked better than trying to force the session through repeated manual reconnect attempts.
The third major challenge was the behavior at 115200. This was not a setup mistake. It was an experimental result. At 115200, the system often showed low RTT for the packets that succeeded, but packet loss rose sharply, especially for larger payloads. That was a critical finding because it would have been easy to misinterpret the low-latency successful packets as evidence that 115200 was the best rate. In reality, once loss and goodput were considered, 115200 was the worst overall operating point of the tested rates.
The fourth challenge was analytical rather than electrical: when plotting the results, the figure-level legend and title overlapped in some of the ECDF, histogram, and scatter plots. I resolved that by moving the legend using bbox_to_anchor(...), lowering the title slightly, and reserving more top margin with tight_layout(rect=...). That fix made the raw-data plots much more usable for interpretation.
Reconfiguring the HC-05 in AT mode
Every UART-rate run required the HC-05 to be reconfigured in AT mode and then returned to normal data mode.
The general sequence was:
- upload an AT-mode passthrough sketch to the Uno,
- place the HC-05 in AT mode,
- open the Serial Monitor at the AT-mode baud rate,
- verify AT communication,
- set the UART rate,
- confirm it with
AT+UART?, - power-cycle the board and return the module to normal mode,
- upload the benchmark firmware with the matching baud rate.
The AT-mode passthrough sketch used for configuration is shown below.
AT-mode passthrough firmware
#include <SoftwareSerial.h>

SoftwareSerial BT(10, 11); // RX, TX

const long PC_BAUD = 38400;
const long HC05_AT_BAUD = 38400;

void setup() {
  Serial.begin(PC_BAUD);
  BT.begin(HC05_AT_BAUD);
}

void loop() {
  if (Serial.available()) {
    BT.write(Serial.read());
  }

  if (BT.available()) {
    Serial.write(BT.read());
  }
}
Once this sketch was running and the HC-05 was in AT mode, I used commands such as:
AT
AT+UART?
AT+UART=38400,0,0
or
AT+UART=57600,0,0
AT+UART=115200,0,0
The important rule was simple: after changing the HC-05 UART setting, the benchmark firmware on the Uno had to be updated to the exact same rate before the benchmark would work correctly again.
Benchmark firmware used for the UART-rate study
The benchmark firmware remained the same packet-echo design as before, but with the UART rate promoted to a configurable constant.
#include <SoftwareSerial.h>

SoftwareSerial BT(10, 11); // RX, TX

const long BT_BAUD = 9600;   // Change for each experiment
const uint8_t START_BYTE = 0x7E;
const uint8_t MAX_PAYLOAD = 64;
const unsigned long BYTE_TIMEOUT_MS = 50;

bool readByteWithTimeout(Stream &s, uint8_t &out, unsigned long timeoutMs) {
  unsigned long start = millis();
  while (millis() - start < timeoutMs) {
    if (s.available()) {
      out = (uint8_t)s.read();
      return true;
    }
  }
  return false;
}

uint8_t computeChecksum(uint16_t seq, uint8_t len, const uint8_t *payload) {
  uint8_t cs = (uint8_t)(seq >> 8) ^ (uint8_t)(seq & 0xFF) ^ len;
  for (uint8_t i = 0; i < len; i++) {
    cs ^= payload[i];
  }
  return cs;
}

void setup() {
  BT.begin(BT_BAUD);
}

void loop() {
  static uint8_t payload[MAX_PAYLOAD];

  if (!BT.available()) {
    return;
  }

  uint8_t startByte = (uint8_t)BT.read();
  if (startByte != START_BYTE) {
    return;
  }

  uint8_t seqHi, seqLo, len, rxChecksum;

  if (!readByteWithTimeout(BT, seqHi, BYTE_TIMEOUT_MS)) return;
  if (!readByteWithTimeout(BT, seqLo, BYTE_TIMEOUT_MS)) return;
  if (!readByteWithTimeout(BT, len, BYTE_TIMEOUT_MS)) return;

  if (len > MAX_PAYLOAD) {
    return;
  }

  for (uint8_t i = 0; i < len; i++) {
    if (!readByteWithTimeout(BT, payload[i], BYTE_TIMEOUT_MS)) return;
  }

  if (!readByteWithTimeout(BT, rxChecksum, BYTE_TIMEOUT_MS)) return;

  uint16_t seq = ((uint16_t)seqHi << 8) | seqLo;
  uint8_t calcChecksum = computeChecksum(seq, len, payload);

  if (calcChecksum != rxChecksum) {
    return;
  }

  BT.write(START_BYTE);
  BT.write(seqHi);
  BT.write(seqLo);
  BT.write(len);
  BT.write(payload, len);
  BT.write(calcChecksum);
}
This firmware did exactly what the experiment needed and nothing more. It waited for a valid packet, verified it, and echoed it back unchanged. That minimal behavior kept the embedded-side timing contribution small.
Python benchmark script
The Ubuntu-side benchmark script remained the measurement authority. It opened a Bluetooth RFCOMM socket, built structured packets, measured RTT, logged successes and failures, and saved both raw and summary CSV files. For the UART-rate sweep, the script also took a tag so that each output file carried its condition, rate, and run identity in the filename.
import socket
import time
import csv
import statistics
import argparse

HC05_ADDR = "00:14:03:05:0A:0C"
RFCOMM_CHANNEL = 1

START_BYTE = 0x7E
TIMEOUT_S = 1.0

def compute_checksum(seq, payload):
    cs = ((seq >> 8) & 0xFF) ^ (seq & 0xFF) ^ len(payload)
    for b in payload:
        cs ^= b
    return cs & 0xFF

def build_packet(seq, payload):
    return bytes([
        START_BYTE,
        (seq >> 8) & 0xFF,
        seq & 0xFF,
        len(payload)
    ]) + payload + bytes([compute_checksum(seq, payload)])

def recv_exact(sock, n):
    data = bytearray()
    while len(data) < n:
        chunk = sock.recv(n - len(data))
        if not chunk:
            raise ConnectionError("Socket closed while receiving data")
        data.extend(chunk)
    return bytes(data)

def read_packet(sock):
    while True:
        b = recv_exact(sock, 1)
        if b[0] == START_BYTE:
            break

    header = recv_exact(sock, 3)
    seq = (header[0] << 8) | header[1]
    length = header[2]

    payload = recv_exact(sock, length)
    rx_checksum = recv_exact(sock, 1)[0]

    calc = compute_checksum(seq, payload)
    if calc != rx_checksum:
        raise ValueError("Checksum mismatch")

    return seq, payload

def summarize(values):
    if not values:
        return None
    return {
        "count": len(values),
        "mean_ms": statistics.mean(values),
        "min_ms": min(values),
        "max_ms": max(values),
        "stdev_ms": statistics.stdev(values) if len(values) > 1 else 0.0
    }

def connect_with_retries(max_attempts=5, delay_s=3.0):
    last_error = None

    for attempt in range(1, max_attempts + 1):
        sock = socket.socket(
            socket.AF_BLUETOOTH,
            socket.SOCK_STREAM,
            socket.BTPROTO_RFCOMM
        )
        sock.settimeout(10.0)

        try:
            print(f"Connect attempt {attempt}/{max_attempts}...")
            sock.connect((HC05_ADDR, RFCOMM_CHANNEL))
            print("Connected.")
            return sock
        except Exception as e:
            last_error = e
            print(f"Connect attempt failed: {e}")
            sock.close()
            if attempt < max_attempts:
                print(f"Waiting {delay_s} seconds before retry...")
                time.sleep(delay_s)

    raise last_error

def parse_args():
    parser = argparse.ArgumentParser()
    parser.add_argument("--tag", required=True, help="Experiment tag, e.g. 1m_38400_run01")
    parser.add_argument("--trials", type=int, default=100)
    parser.add_argument("--payload-sizes", type=int, nargs="+", default=[1, 8, 32, 64])
    return parser.parse_args()

def main():
    args = parse_args()

    raw_filename = f"hc05_qos_raw_results_{args.tag}.csv"
    summary_filename = f"hc05_qos_summary_{args.tag}.csv"

    sock = connect_with_retries()
    all_results = []

    try:
        time.sleep(1.0)

        with open(raw_filename, "w", newline="") as f:
            writer = csv.writer(f)
            writer.writerow([
                "payload_size",
                "trial",
                "sequence",
                "success",
                "rtt_ms",
                "error"
            ])

            seq = 0

            for payload_size in args.payload_sizes:
                print(f"\nTesting payload size = {payload_size} bytes")
                rtts = []
                successes = 0
                condition_start = time.perf_counter()

                for trial in range(args.trials):
                    payload = bytes((trial + i) % 256 for i in range(payload_size))
                    packet = build_packet(seq, payload)

                    try:
                        t0 = time.perf_counter_ns()
                        sock.sendall(packet)

                        rx_seq, rx_payload = read_packet(sock)
                        t1 = time.perf_counter_ns()

                        if rx_seq != seq:
                            raise ValueError(f"Sequence mismatch: expected {seq}, got {rx_seq}")

                        if rx_payload != payload:
                            raise ValueError("Payload mismatch")

                        rtt_ms = (t1 - t0) / 1e6
                        rtts.append(rtt_ms)
                        successes += 1

                        writer.writerow([payload_size, trial, seq, 1, rtt_ms, ""])

                    except Exception as e:
                        writer.writerow([payload_size, trial, seq, 0, "", str(e)])

                    seq = (seq + 1) & 0xFFFF

                elapsed = time.perf_counter() - condition_start
                loss_ratio = (args.trials - successes) / args.trials
                goodput = (successes * payload_size) / elapsed

                stats = summarize(rtts)

                print(f"  Successes: {successes}/{args.trials}")
                print(f"  Loss ratio: {loss_ratio:.4f}")
                print(f"  Goodput: {goodput:.2f} bytes/sec")

                if stats:
                    print(f"  Mean RTT: {stats['mean_ms']:.3f} ms")
                    print(f"  Min RTT:  {stats['min_ms']:.3f} ms")
                    print(f"  Max RTT:  {stats['max_ms']:.3f} ms")
                    print(f"  Jitter (stdev): {stats['stdev_ms']:.3f} ms")

                all_results.append({
                    "payload_size": payload_size,
                    "successes": successes,
                    "trials": args.trials,
                    "loss_ratio": loss_ratio,
                    "goodput_Bps": goodput,
                    "mean_rtt_ms": stats["mean_ms"] if stats else None,
                    "min_rtt_ms": stats["min_ms"] if stats else None,
                    "max_rtt_ms": stats["max_ms"] if stats else None,
                    "jitter_stdev_ms": stats["stdev_ms"] if stats else None
                })

        with open(summary_filename, "w", newline="") as f:
            writer = csv.writer(f)
            writer.writerow([
                "payload_size",
                "successes",
                "trials",
                "loss_ratio",
                "goodput_Bps",
                "mean_rtt_ms",
                "min_rtt_ms",
                "max_rtt_ms",
                "jitter_stdev_ms"
            ])

            for row in all_results:
                writer.writerow([
                    row["payload_size"],
                    row["successes"],
                    row["trials"],
                    row["loss_ratio"],
                    row["goodput_Bps"],
                    row["mean_rtt_ms"],
                    row["min_rtt_ms"],
                    row["max_rtt_ms"],
                    row["jitter_stdev_ms"]
                ])

        print(f"\nSaved raw results to {raw_filename}")
        print(f"Saved summary results to {summary_filename}")

    finally:
        sock.close()

if __name__ == "__main__":
    main()
The naming convention turned out to be very helpful. Files such as hc05_qos_summary_3m_57600.csv and hc05_qos_raw_results_wall_38400.csv made it much easier to analyze the full study without mixing conditions.
Plot generation
For analysis, I reused the extended plotting workflow from the earlier benchmark so that each condition directory produced the same set of figures:
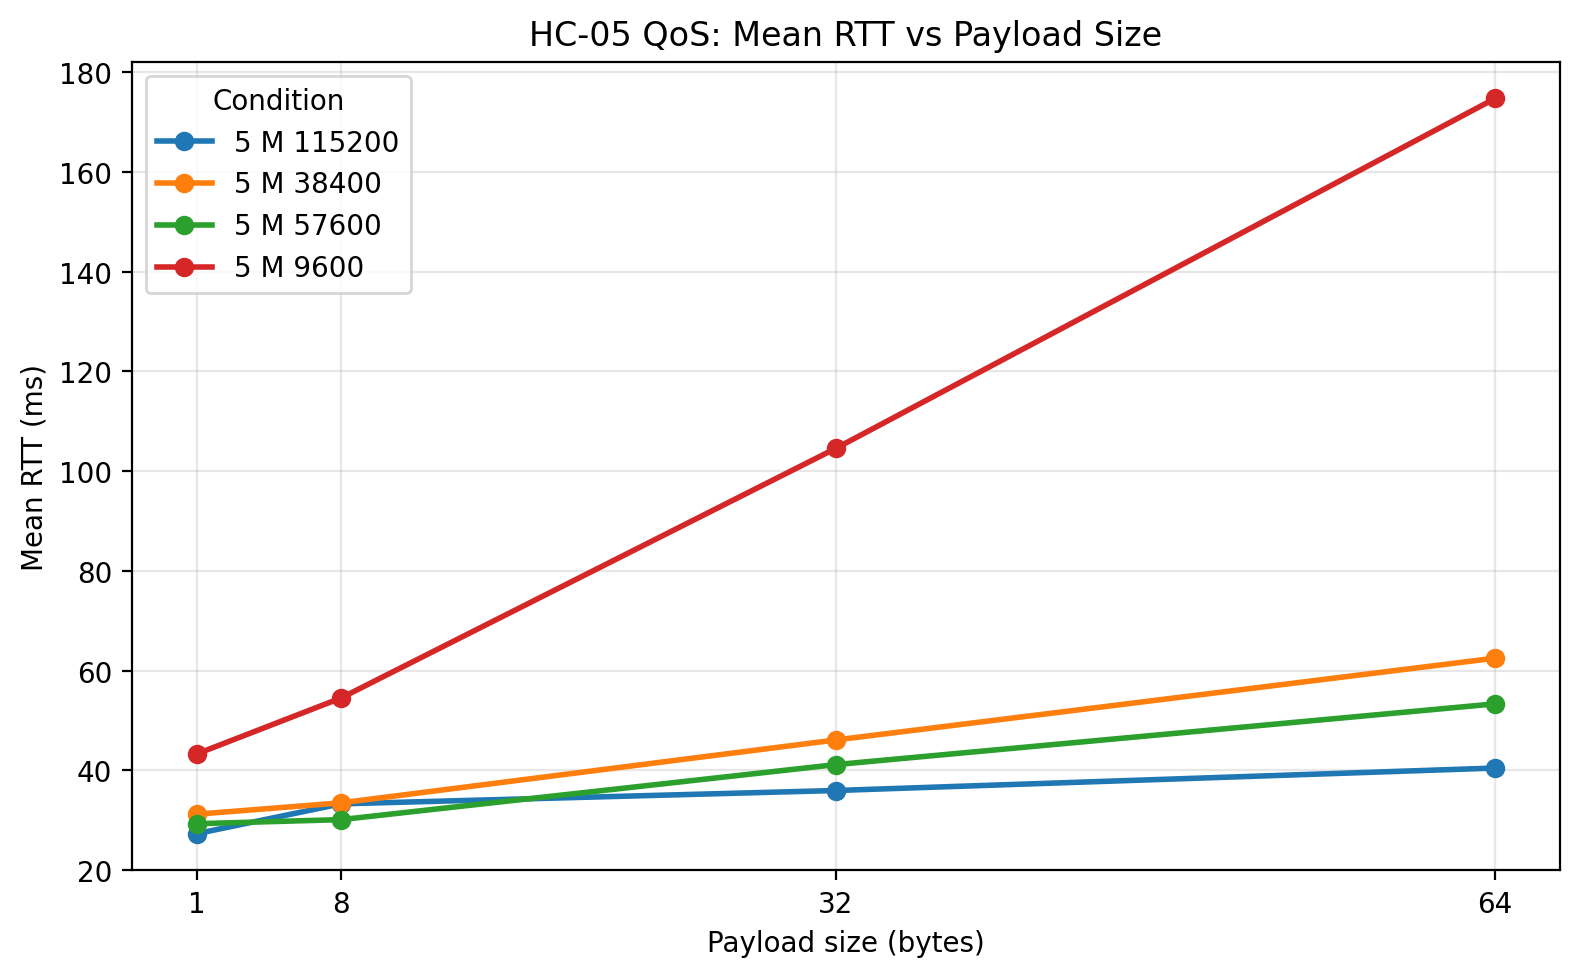
- mean RTT vs payload size
- jitter vs payload size
- goodput vs payload size
- maximum RTT vs payload size
- loss vs payload size
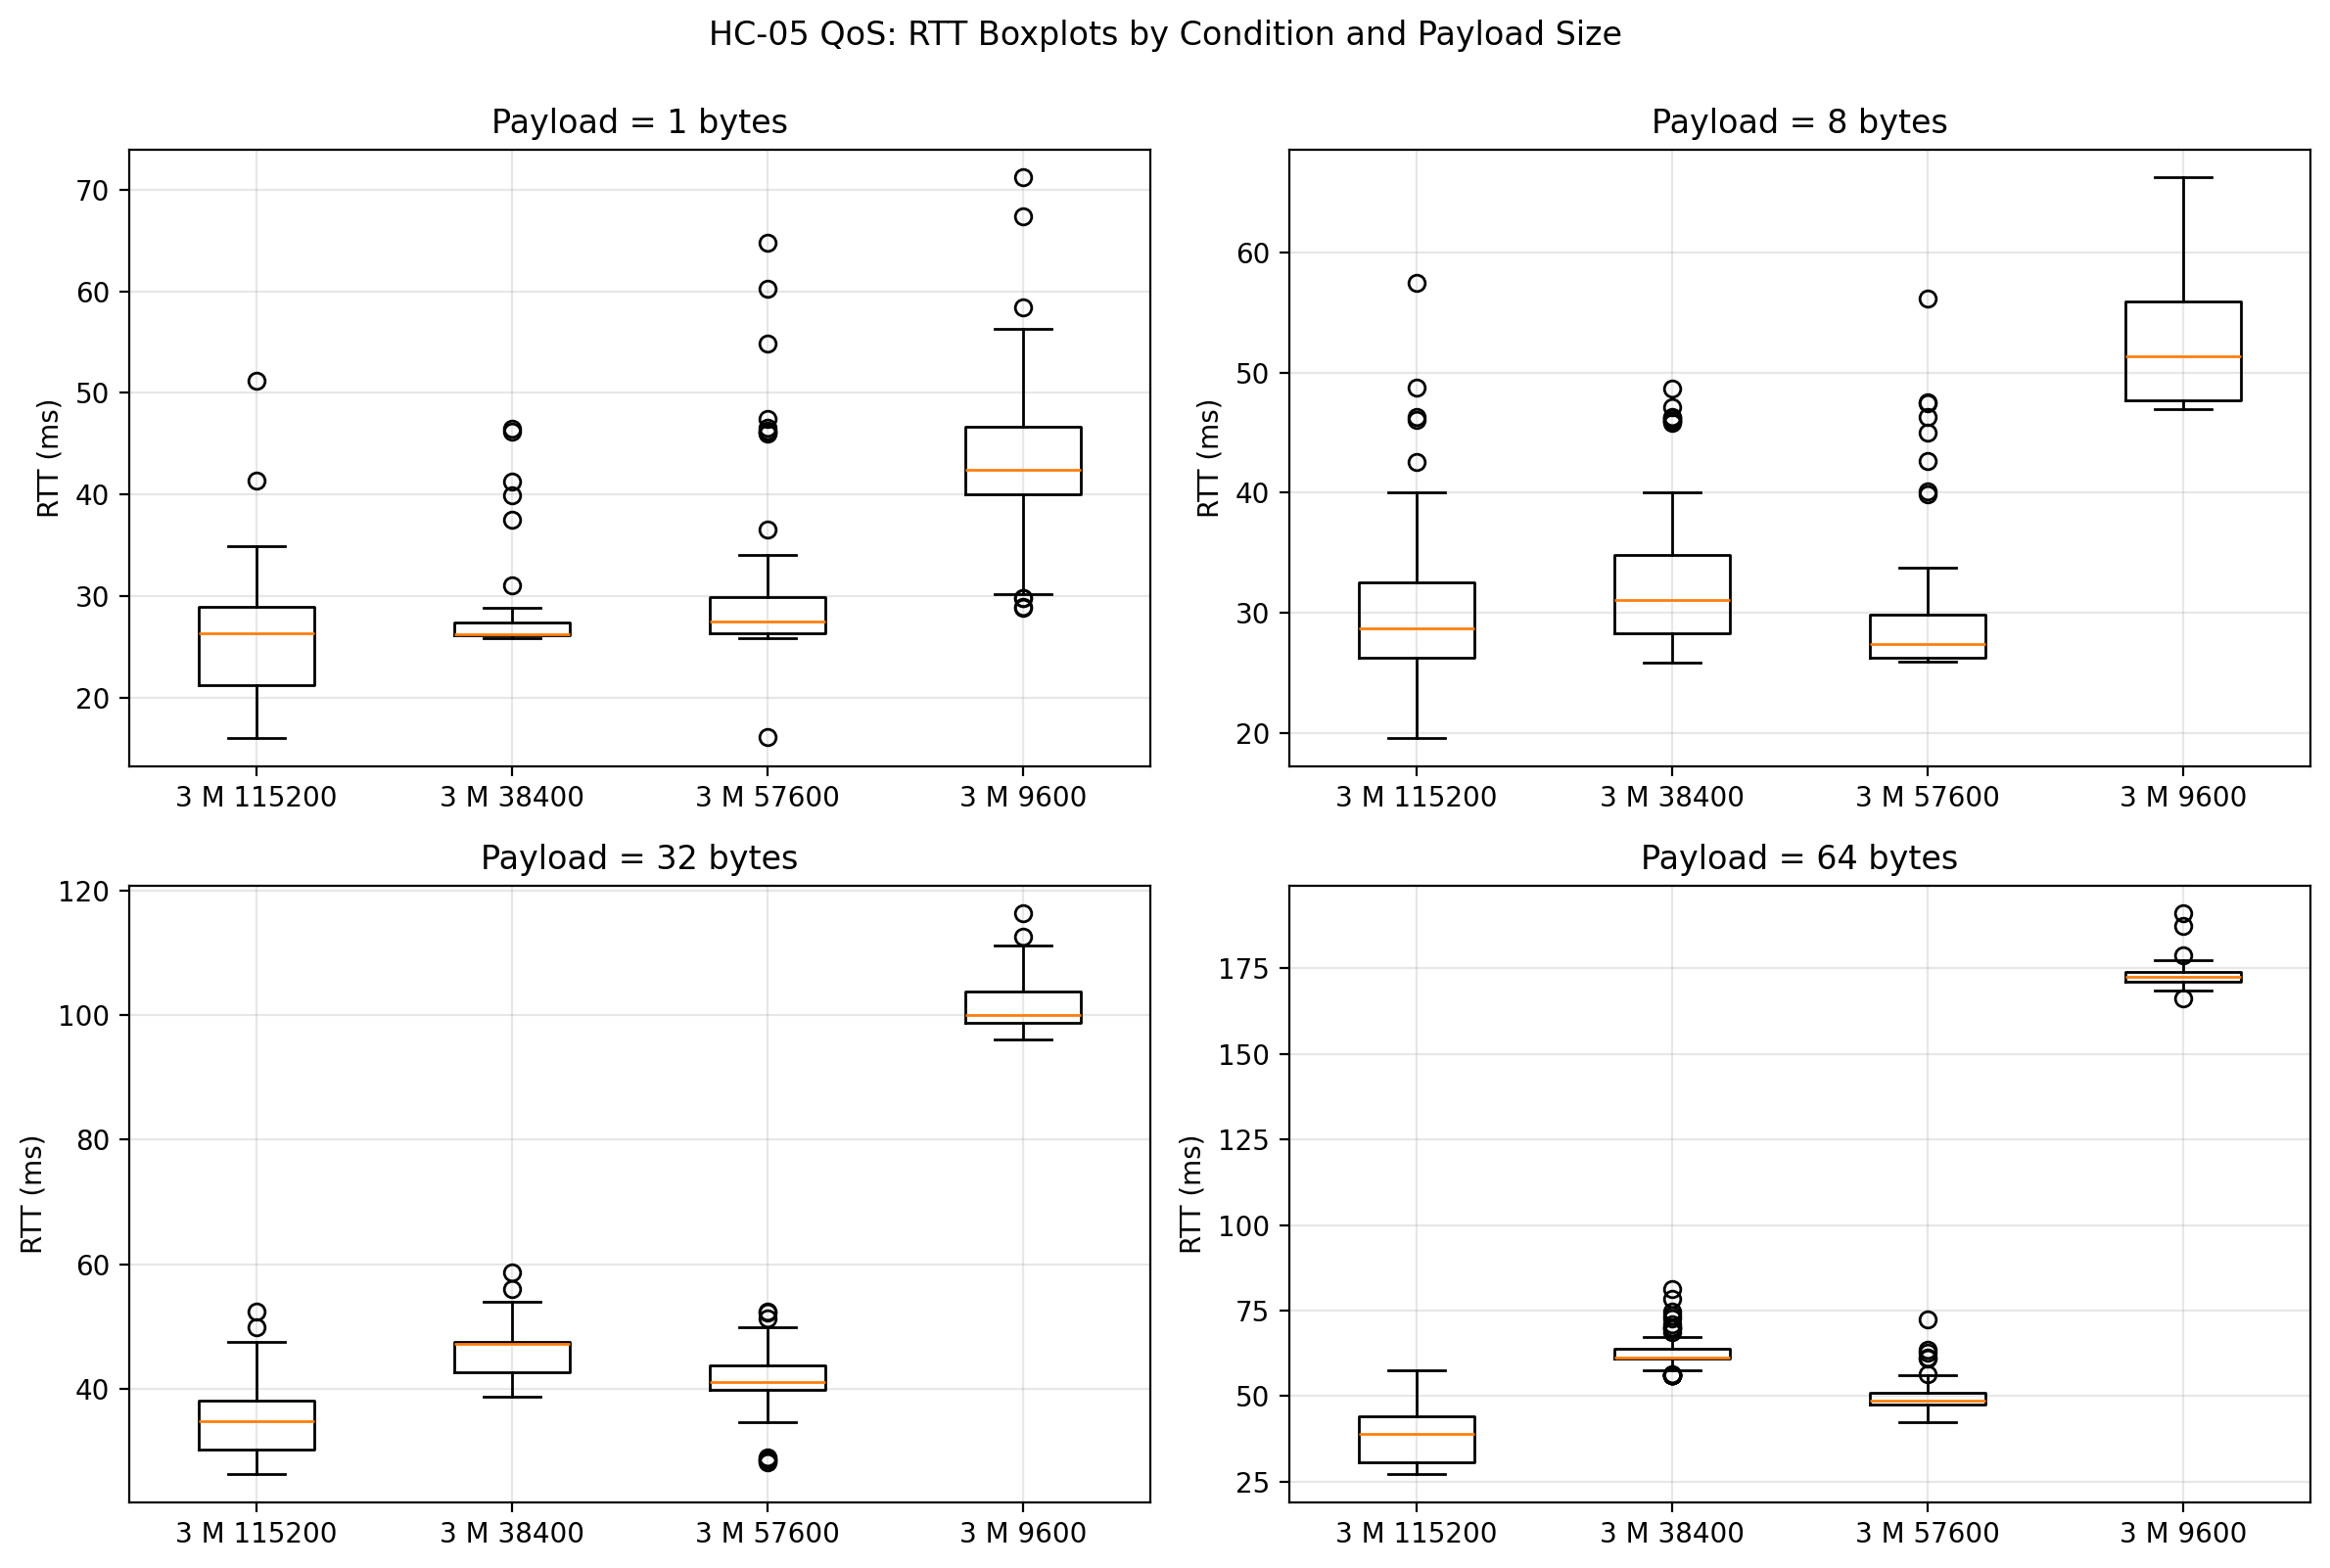
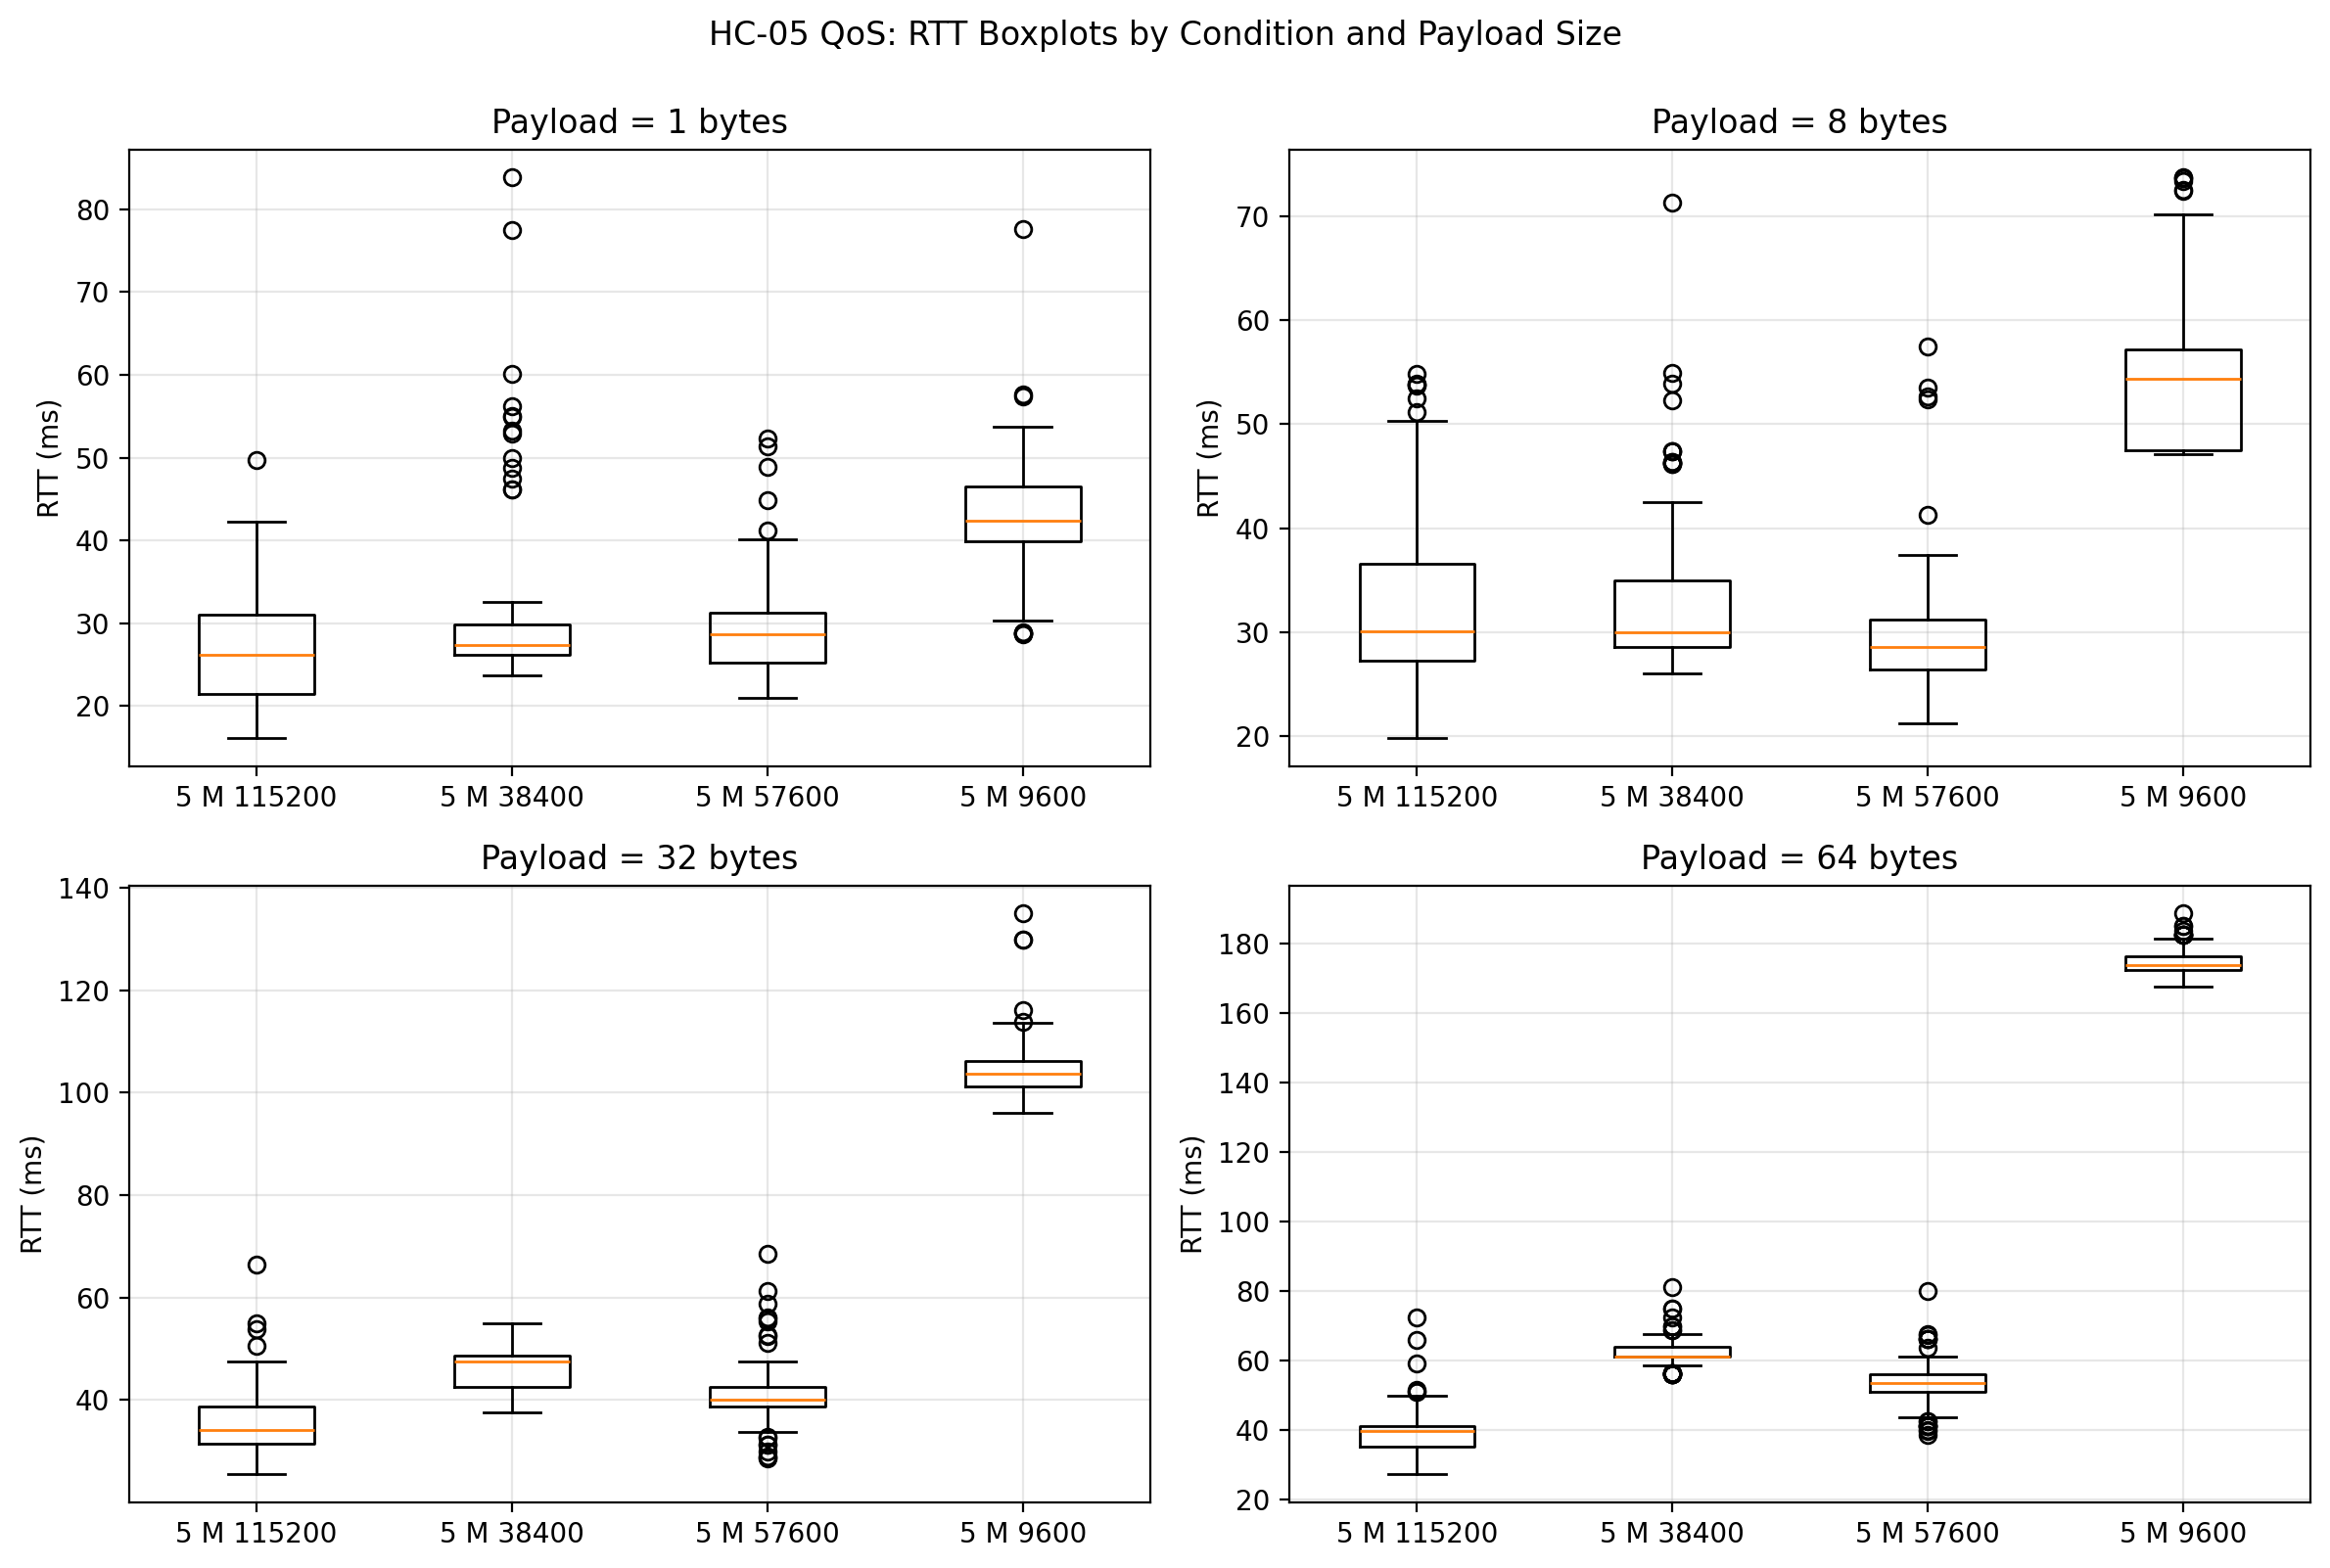
- RTT boxplots by payload size
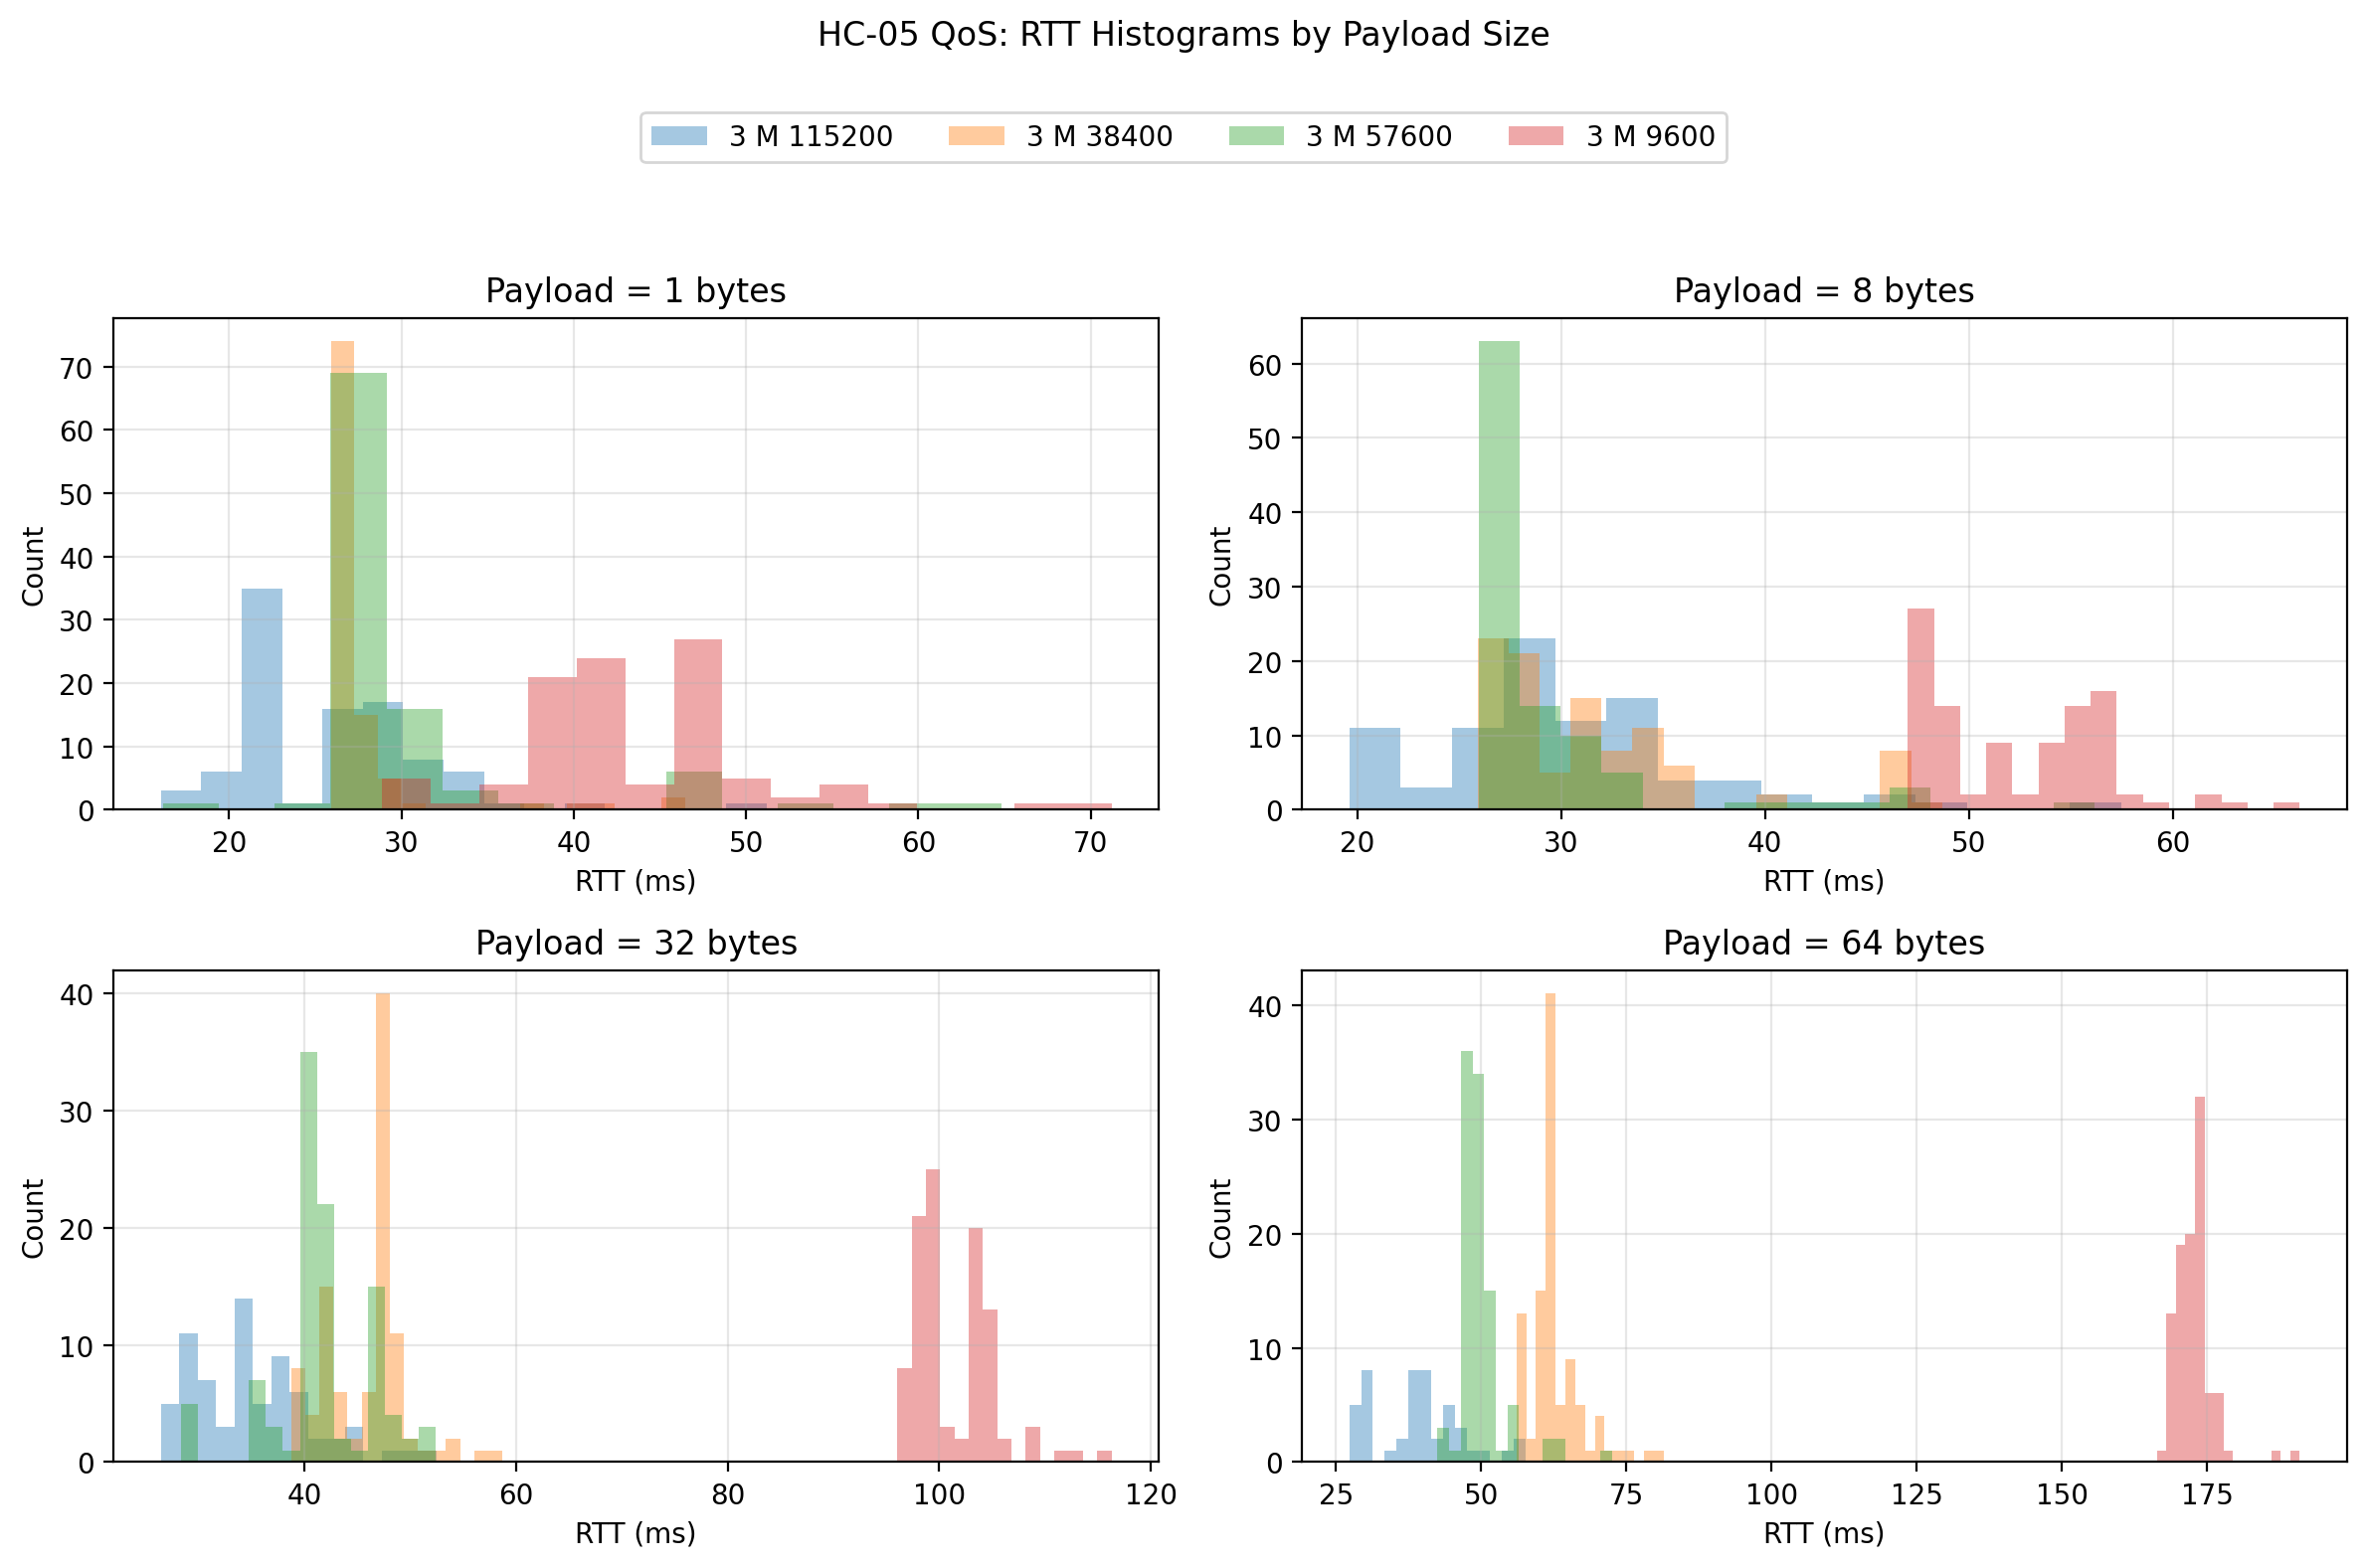
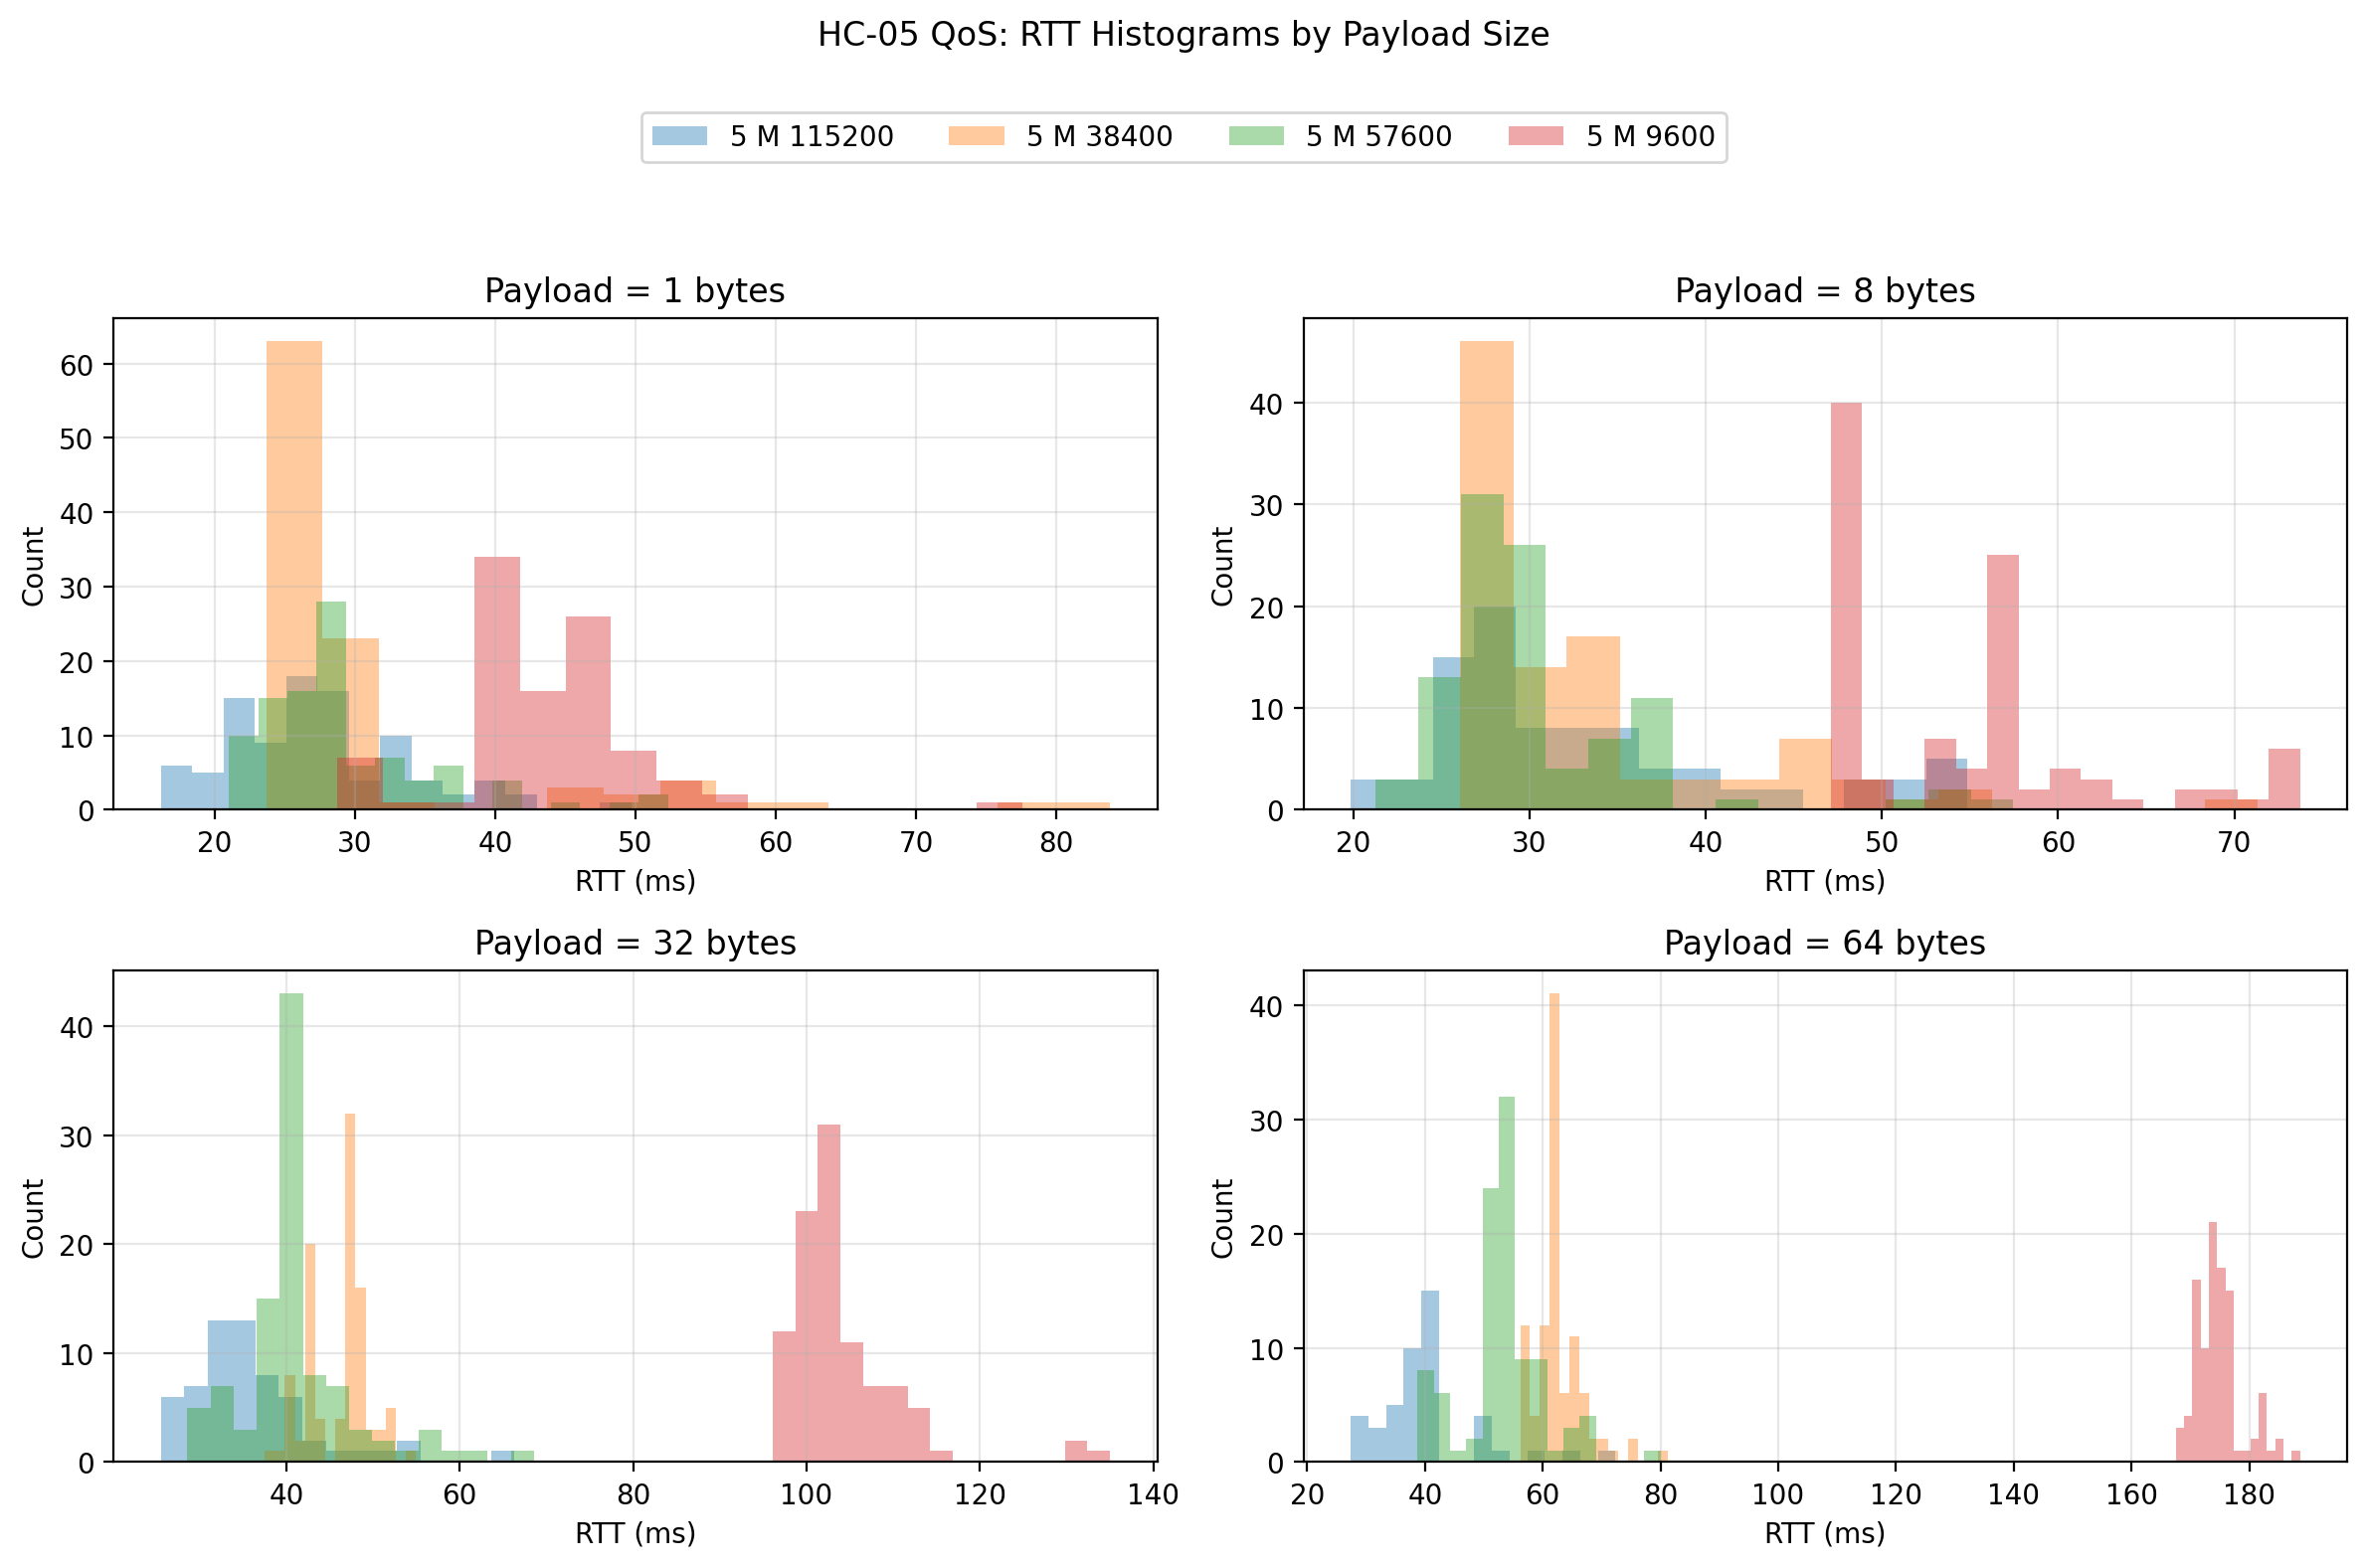
- RTT histograms by payload size
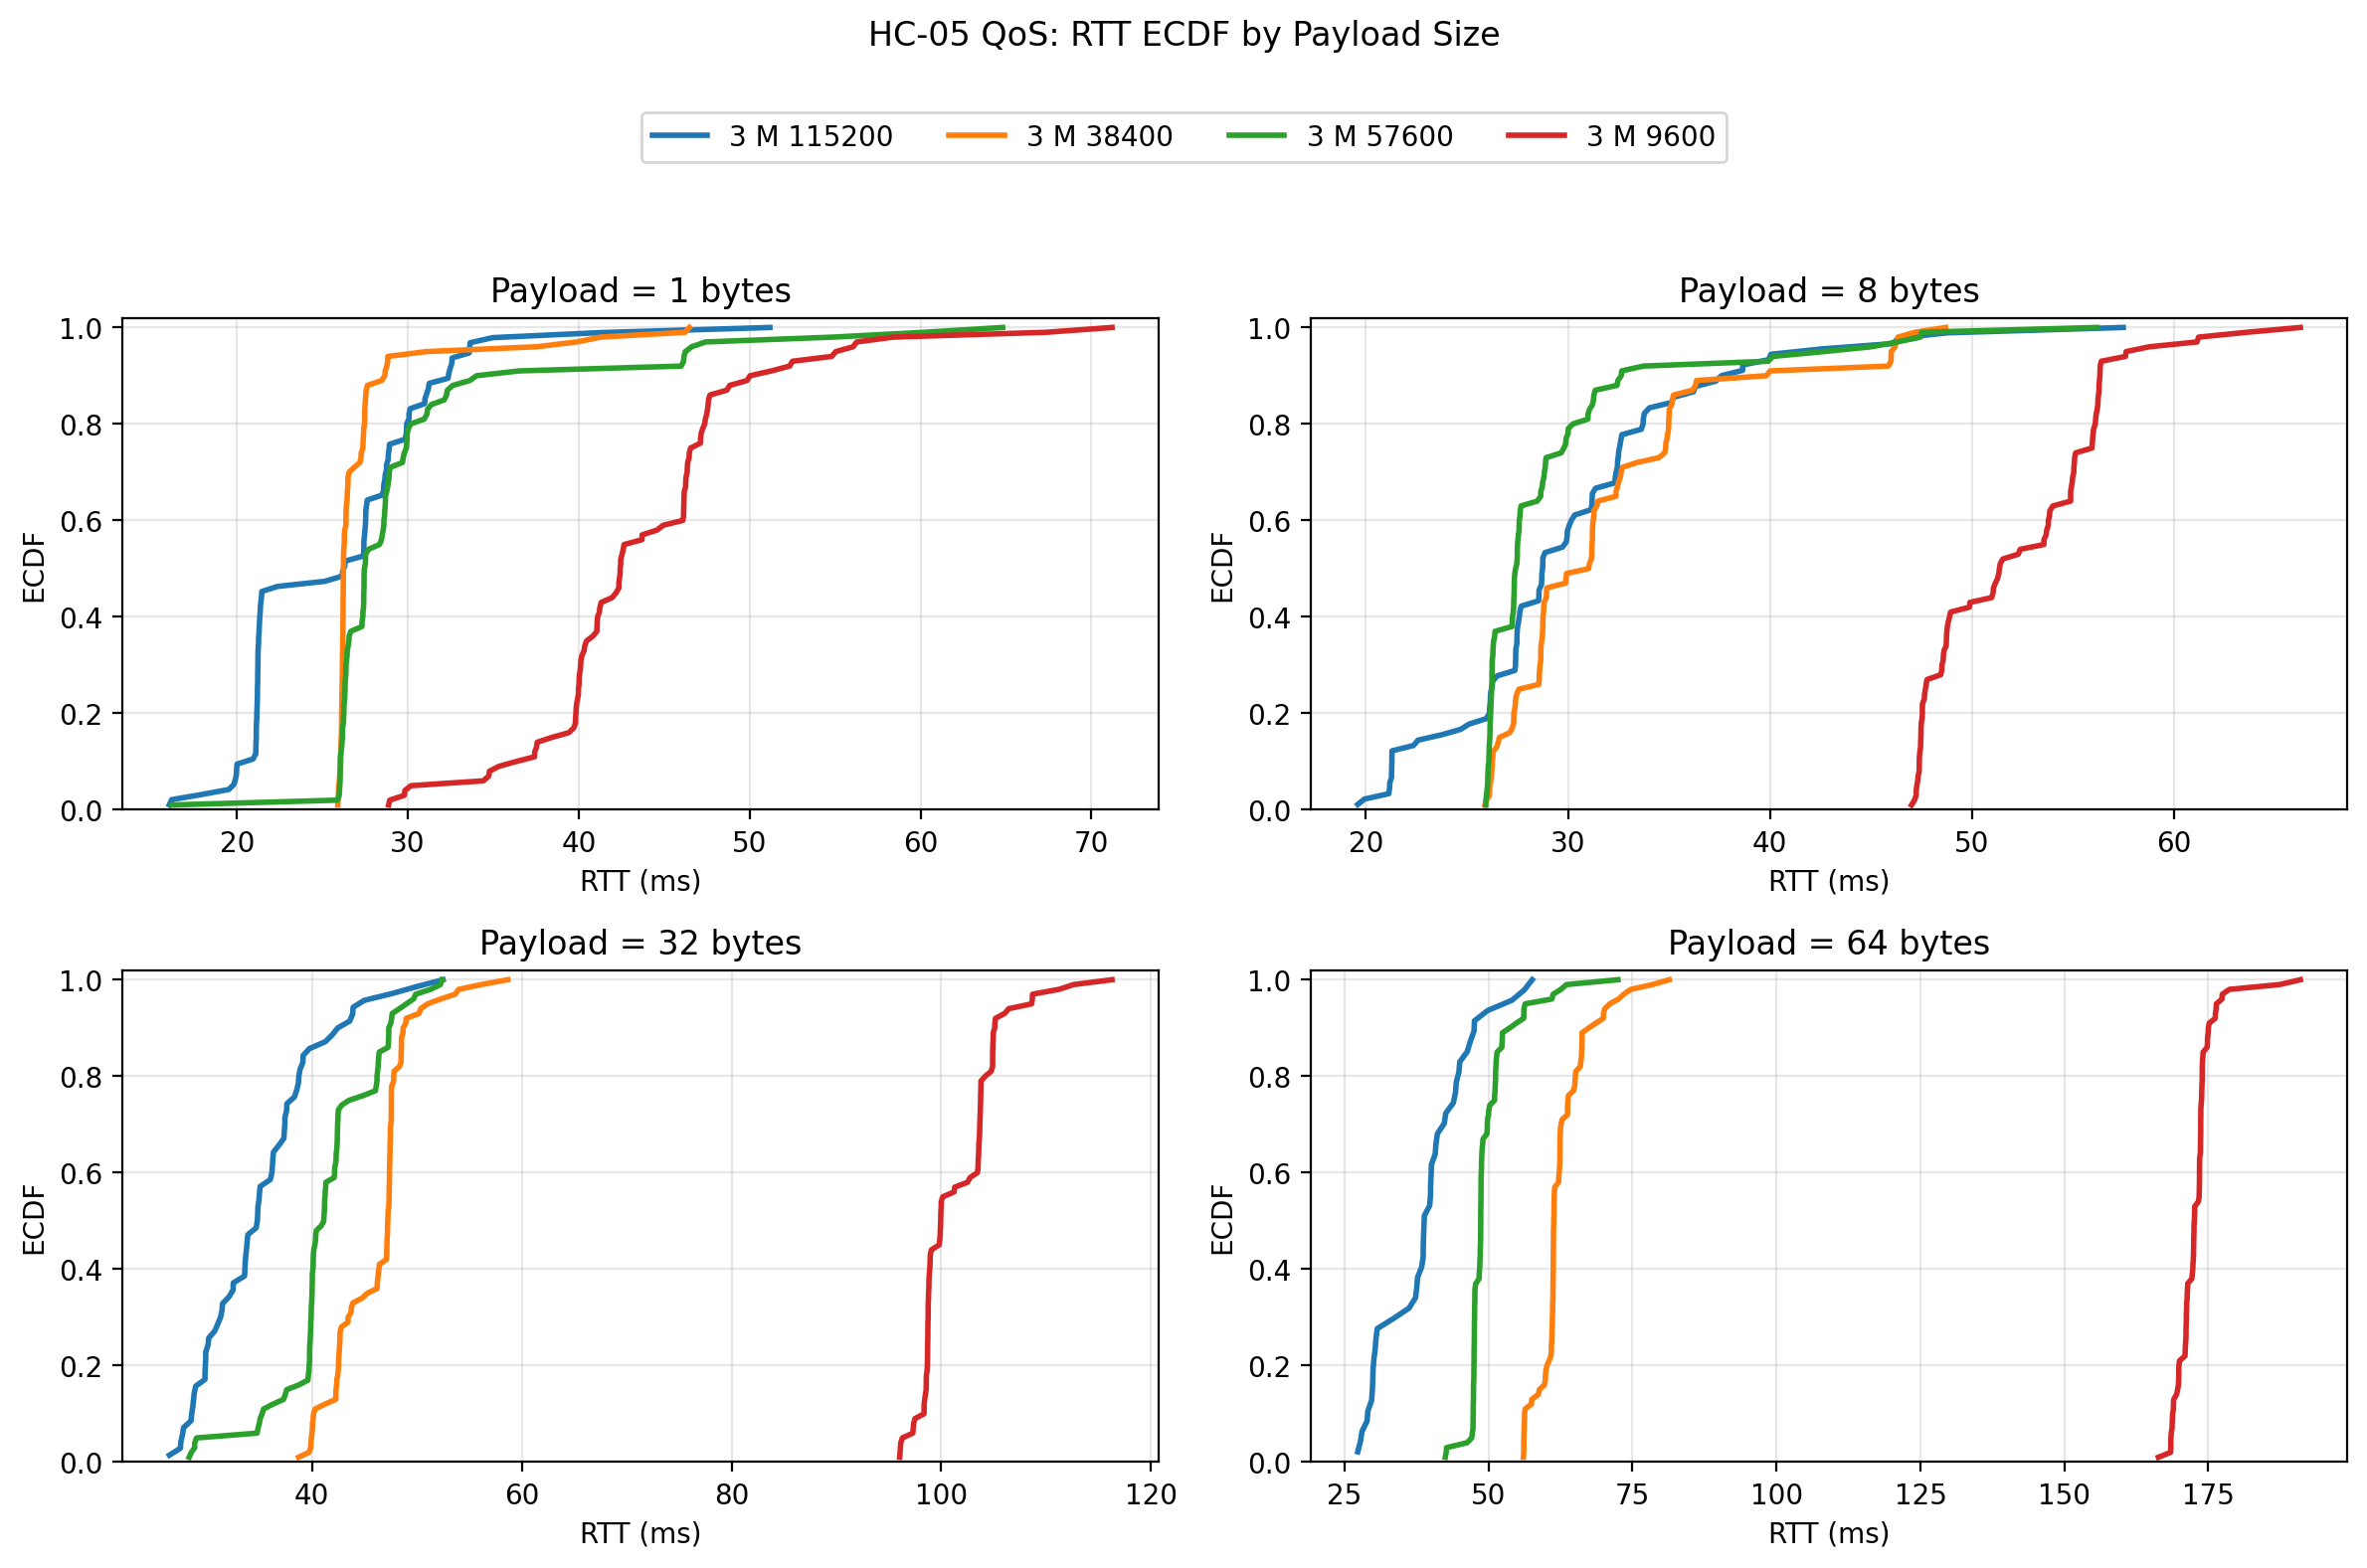
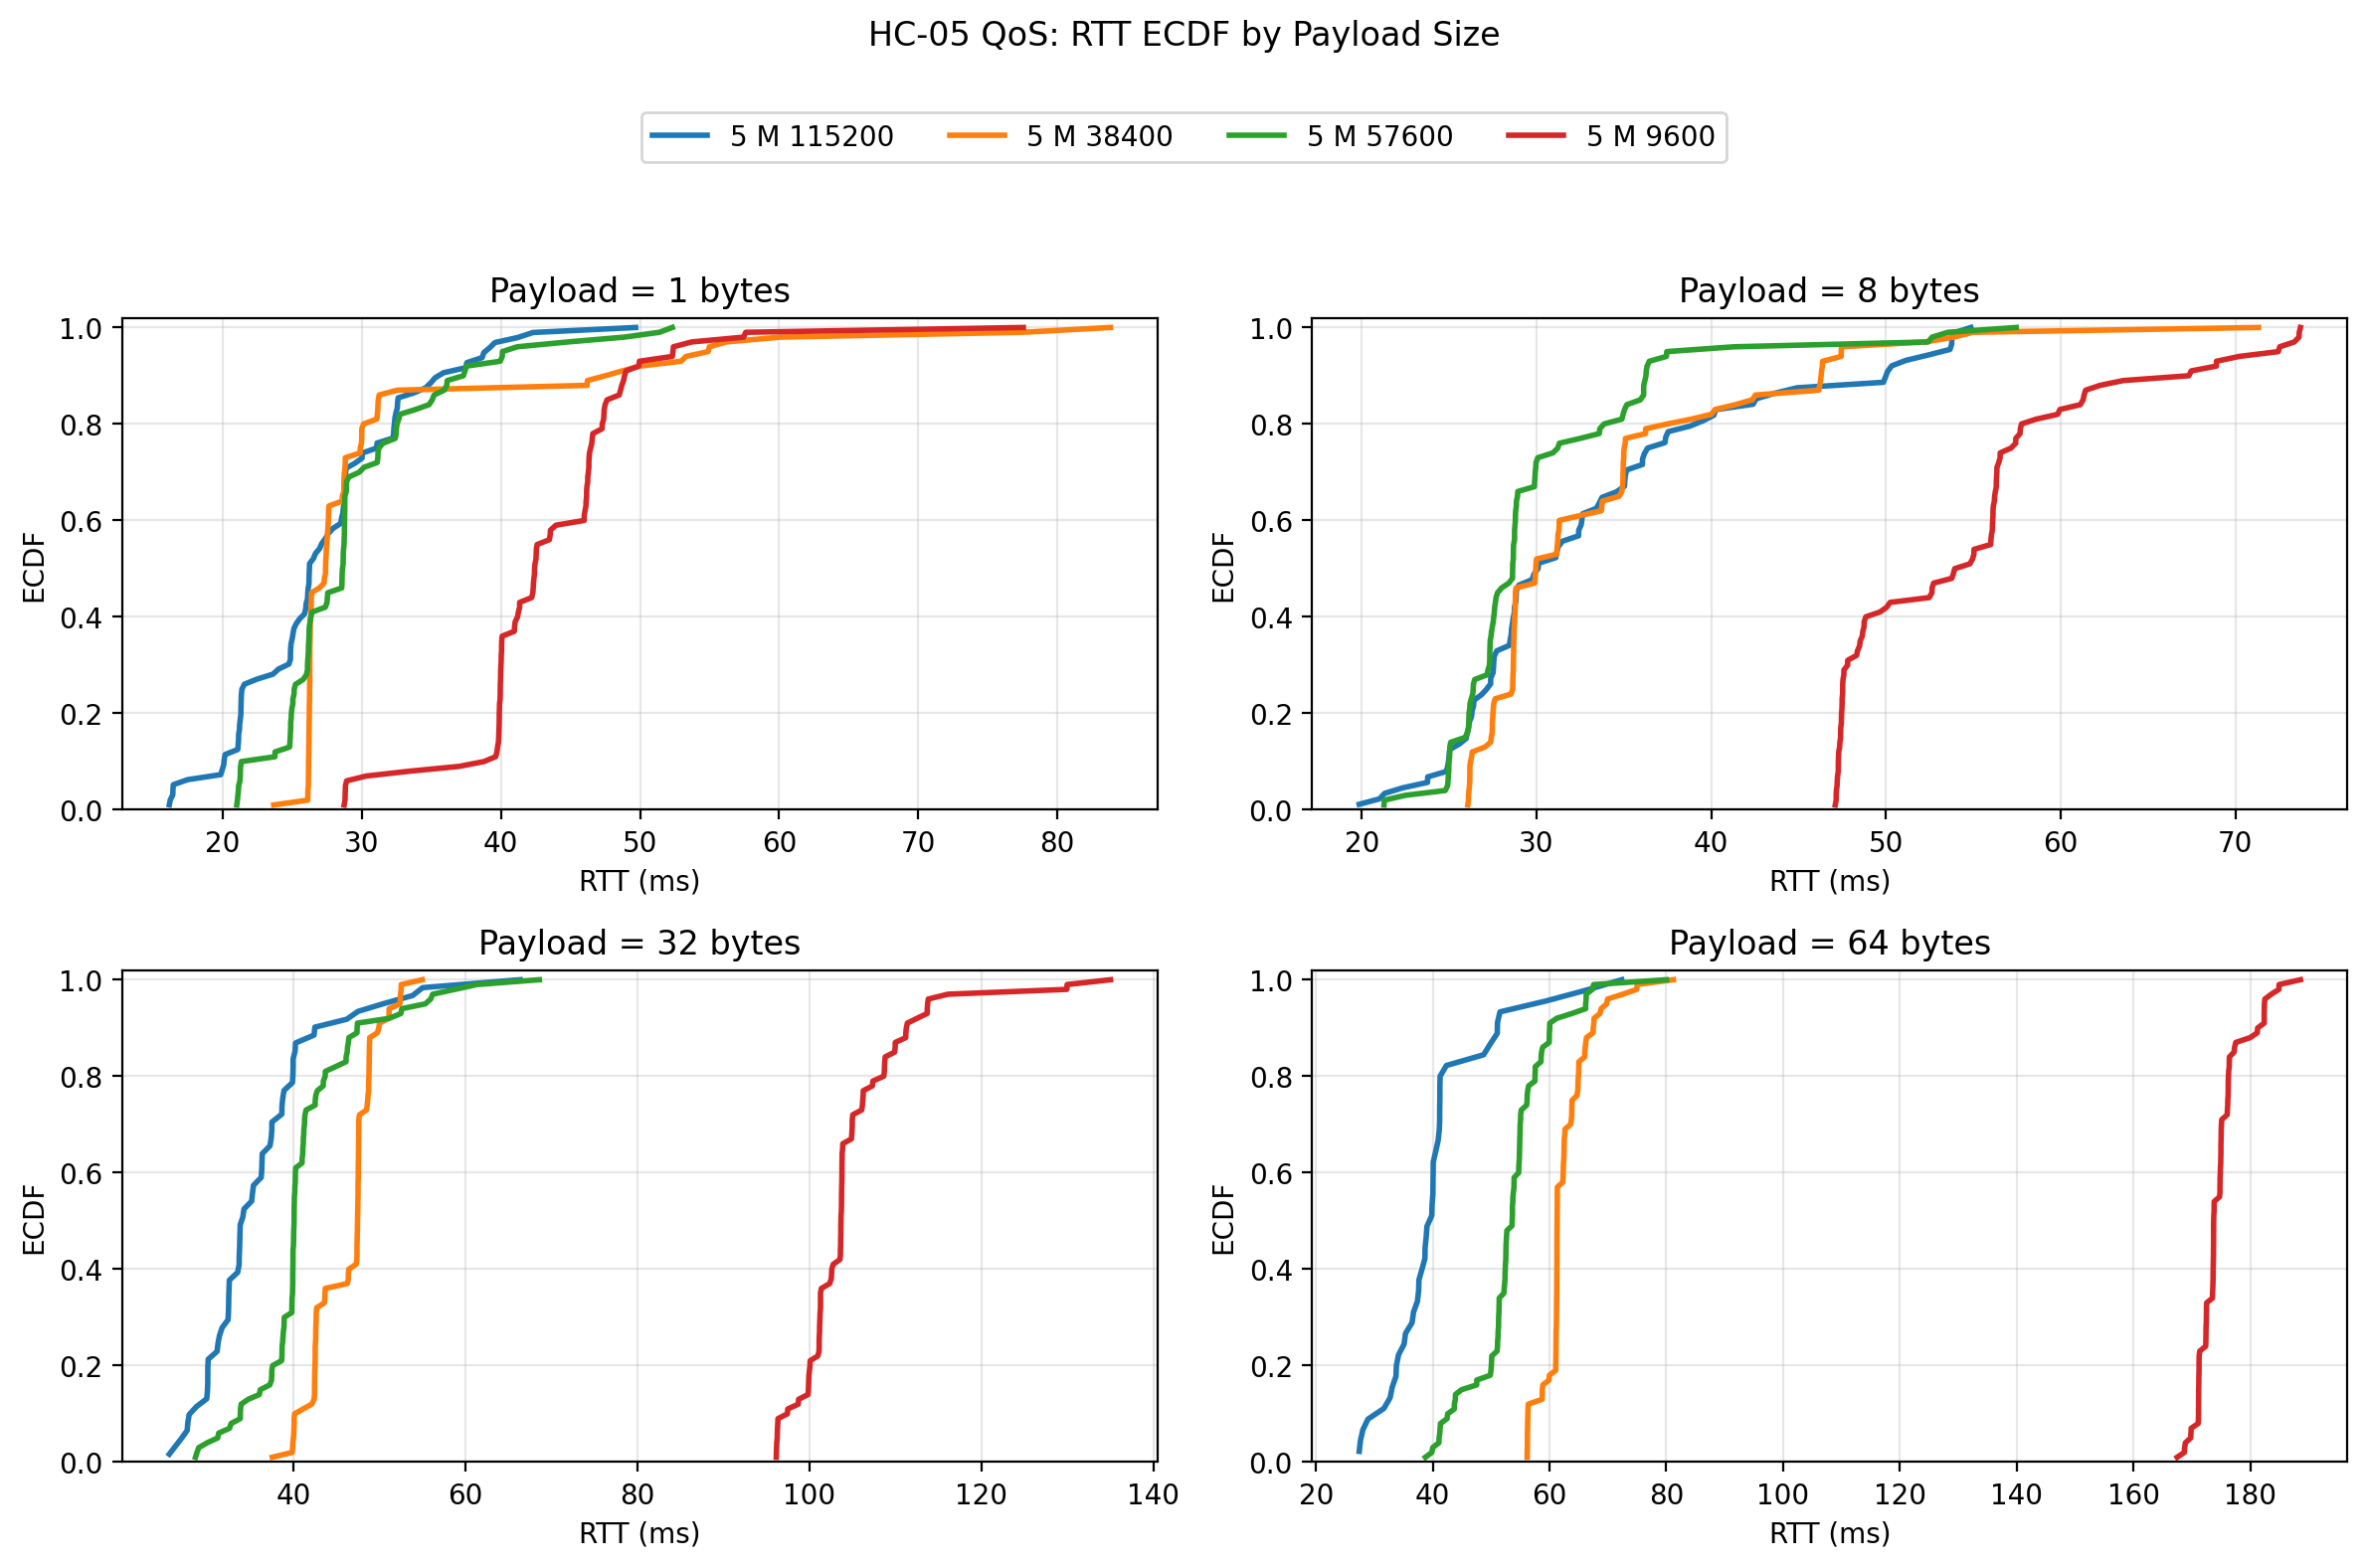
- RTT ECDF by payload size
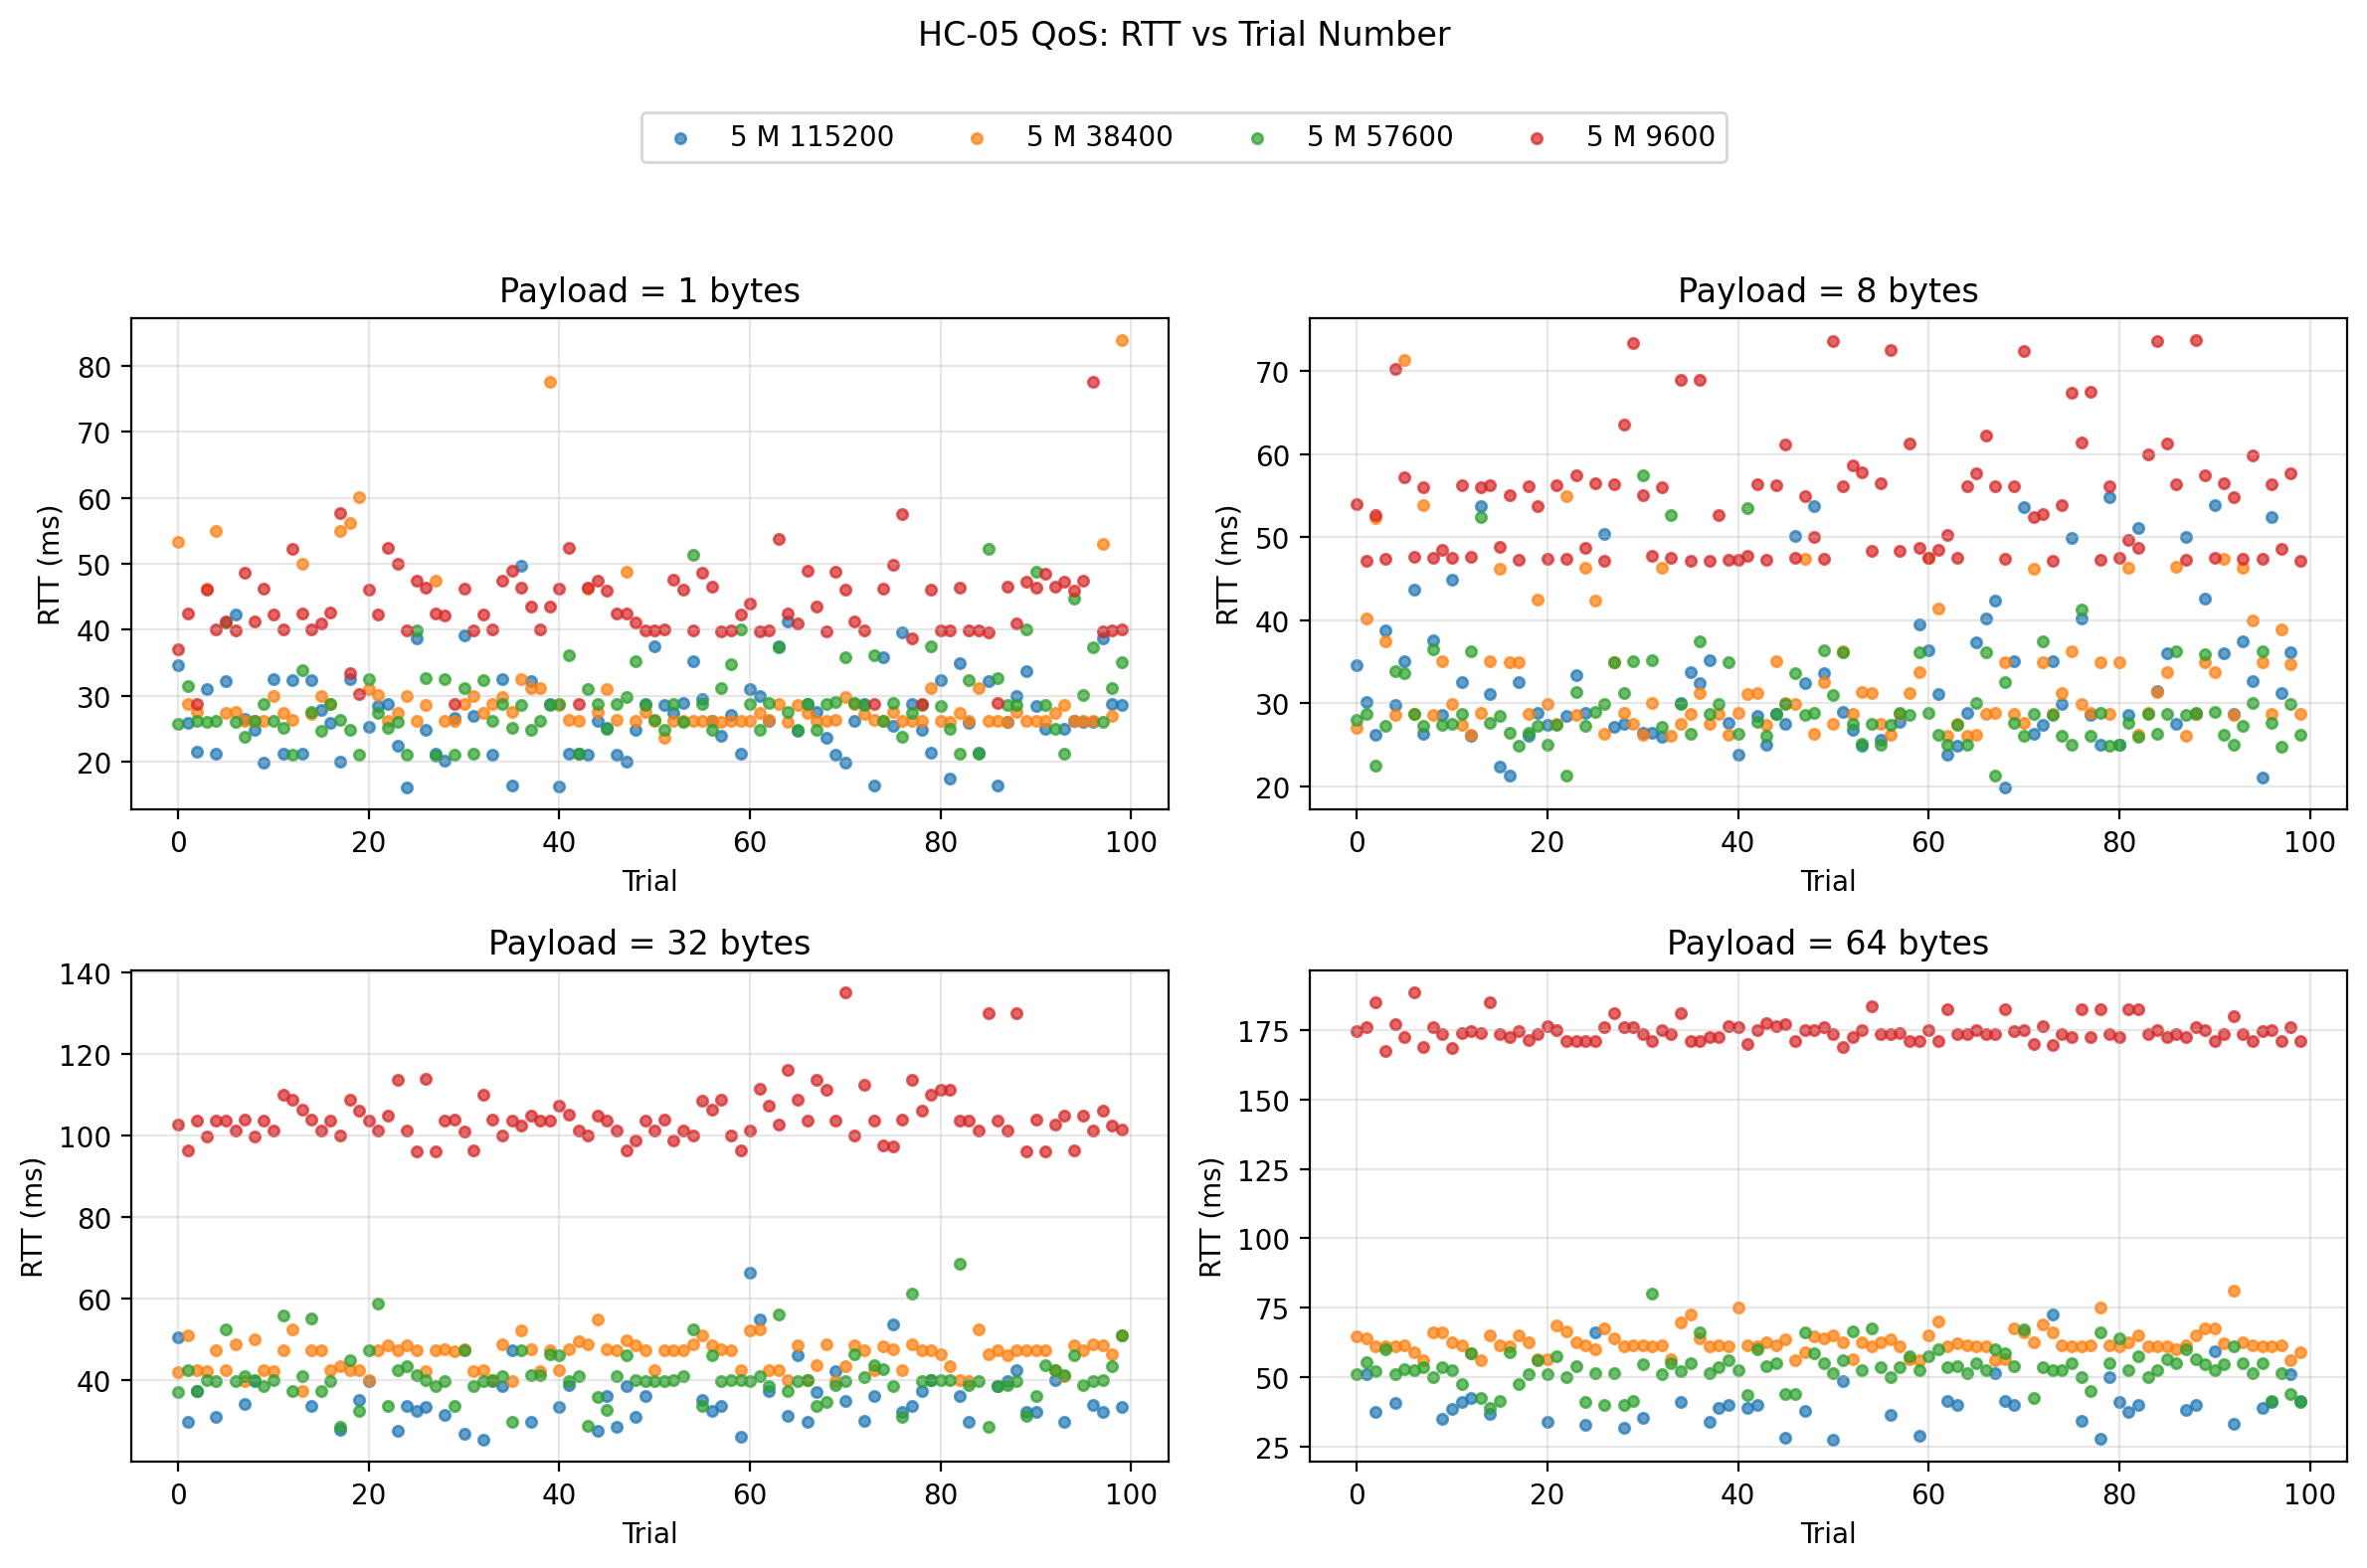
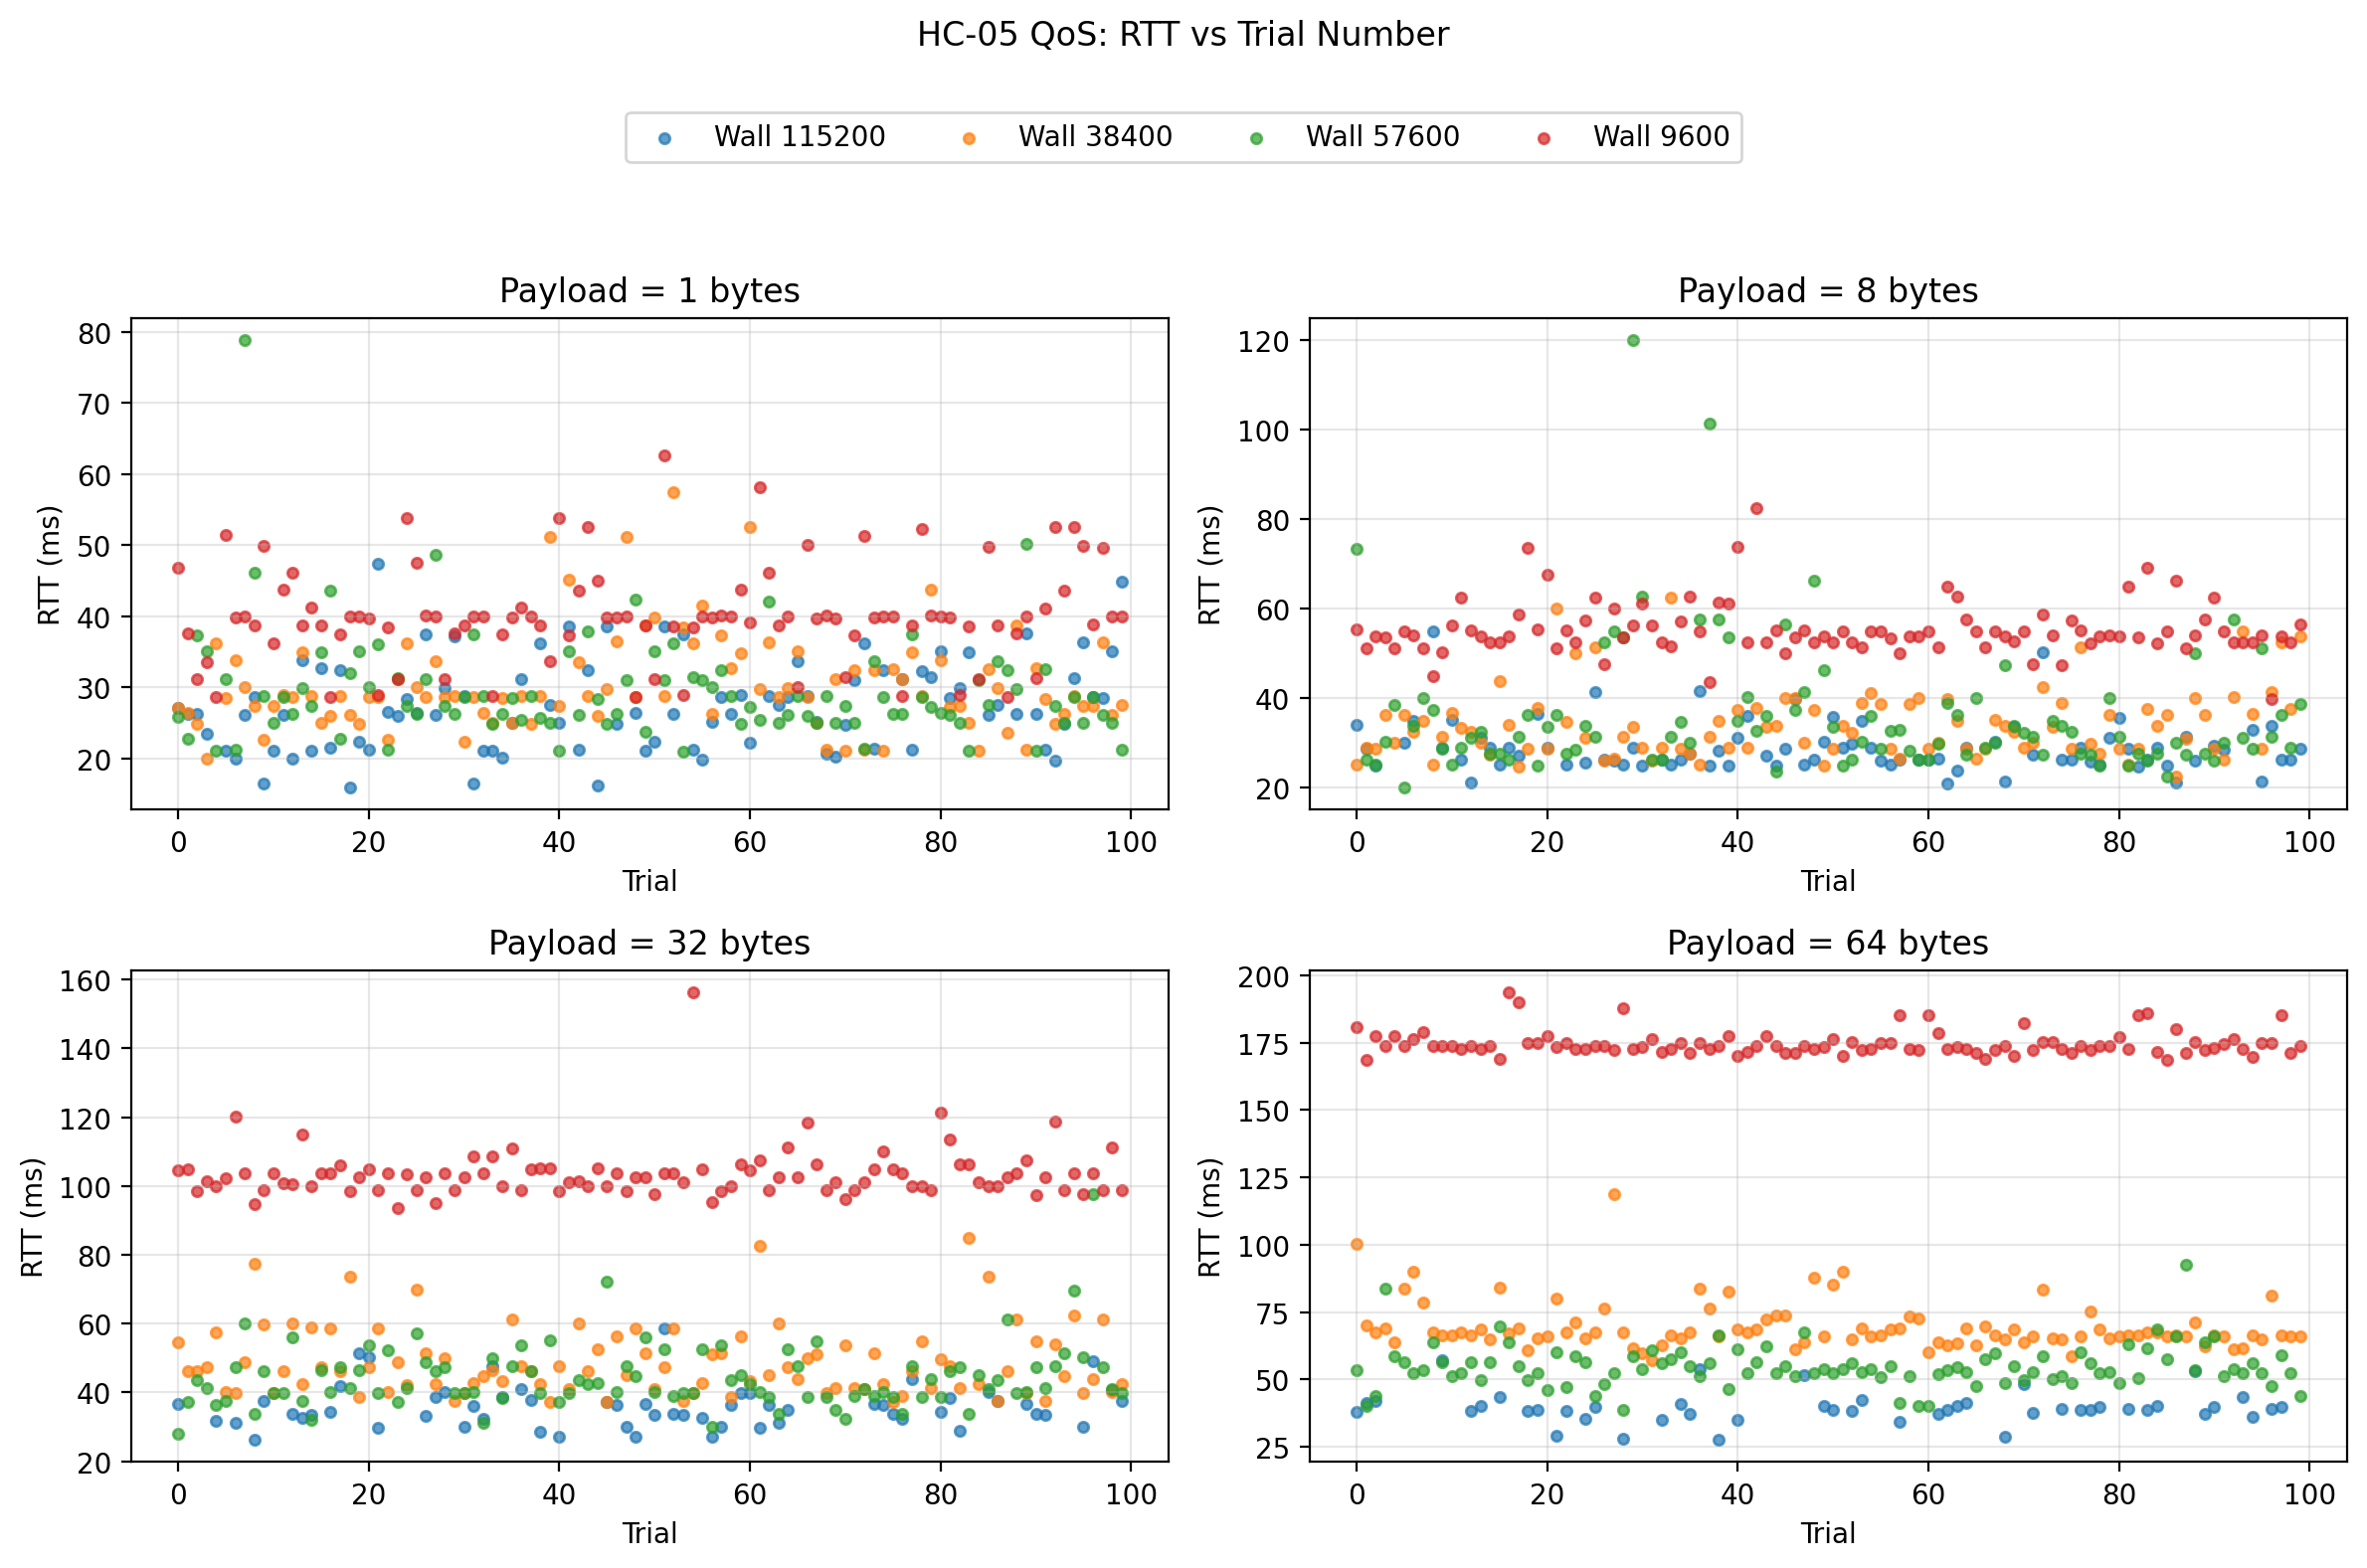
- RTT vs trial number scatter plots
For this post, I assume the extracted image folders are placed under:
/assets/images/hc05-uart-benchmark/
with subfolders:
1m/
/3m/
/5m/
/wall/
If you use a different directory structure, just update the image paths.
Results overview
The results separated the UART rates into three categories very clearly.
9600 was reliable in every tested condition, but slow.
38400 was a large improvement over 9600 and remained fully reliable.
57600 delivered the best overall balance of low RTT, high goodput, and zero packet loss.
115200 produced low RTT on successful packets, but severe packet loss that made it a poor operating point for this platform.
That distinction is the central result of the experiment.
A useful way to see the trend is to look at the 64-byte payload, where the throughput and stability differences become especially visible.
Selected 64-byte summary across all conditions
| Condition | UART | Successes | Loss ratio | Mean RTT (ms) | Jitter SD (ms) | Goodput (B/s) | Max RTT (ms) |
|---|---|---|---|---|---|---|---|
| 1 m | 9600 | 100 | 0.00 | 173.85 | 3.81 | 368.04 | 192.59 |
| 1 m | 38400 | 100 | 0.00 | 65.72 | 5.69 | 973.24 | 89.96 |
| 1 m | 57600 | 100 | 0.00 | 51.71 | 6.05 | 1236.80 | 72.58 |
| 1 m | 115200 | 43 | 0.57 | 37.69 | 7.20 | 55.05 | 56.18 |
| 3 m | 9600 | 100 | 0.00 | 172.73 | 3.31 | 370.39 | 190.99 |
| 3 m | 38400 | 100 | 0.00 | 62.58 | 4.55 | 1021.65 | 81.38 |
| 3 m | 57600 | 100 | 0.00 | 49.77 | 4.22 | 1284.40 | 72.48 |
| 3 m | 115200 | 47 | 0.53 | 38.97 | 7.66 | 63.77 | 57.59 |
| 5 m | 9600 | 100 | 0.00 | 174.72 | 3.90 | 366.21 | 188.61 |
| 5 m | 38400 | 100 | 0.00 | 62.50 | 4.23 | 1023.41 | 81.19 |
| 5 m | 57600 | 100 | 0.00 | 53.34 | 6.82 | 1199.08 | 80.01 |
| 5 m | 115200 | 45 | 0.55 | 40.46 | 9.06 | 58.51 | 72.37 |
| Wood wall | 9600 | 100 | 0.00 | 174.69 | 4.51 | 366.27 | 193.58 |
| Wood wall | 38400 | 100 | 0.00 | 69.52 | 8.97 | 919.91 | 118.73 |
| Wood wall | 57600 | 100 | 0.00 | 54.79 | 7.89 | 1167.06 | 92.55 |
| Wood wall | 115200 | 47 | 0.53 | 39.55 | 5.90 | 60.02 | 57.07 |
This table already shows the broad pattern. Between the stable operating points, 57600 is consistently the fastest and most efficient. 38400 is close behind. 9600 is dramatically slower. 115200 looks attractive if one reads only the successful RTTs, but once loss and goodput are considered, it collapses as a practical operating point.
The 115200 loss profile
The most misleading condition in the entire study was 115200, so it is worth isolating its loss behavior directly.
| Condition | Payload | Successes | Loss ratio | Mean RTT of successes (ms) | Goodput (B/s) |
|---|---|---|---|---|---|
| 1 m | 1 B | 95 | 0.05 | 26.16 | 26.34 |
| 1 m | 8 B | 90 | 0.10 | 29.96 | 56.65 |
| 1 m | 32 B | 60 | 0.40 | 35.14 | 51.46 |
| 1 m | 64 B | 43 | 0.57 | 37.69 | 55.05 |
| 3 m | 1 B | 95 | 0.05 | 25.75 | 17.29 |
| 3 m | 8 B | 90 | 0.10 | 30.06 | 56.61 |
| 3 m | 32 B | 70 | 0.30 | 35.10 | 78.25 |
| 3 m | 64 B | 47 | 0.53 | 38.97 | 63.77 |
| 5 m | 1 B | 96 | 0.04 | 27.30 | 25.82 |
| 5 m | 8 B | 88 | 0.12 | 33.28 | 47.11 |
| 5 m | 32 B | 61 | 0.39 | 35.96 | 55.08 |
| 5 m | 64 B | 45 | 0.55 | 40.46 | 58.51 |
| Wood wall | 1 B | 93 | 0.07 | 27.50 | 16.45 |
| Wood wall | 8 B | 84 | 0.16 | 28.92 | 36.42 |
| Wood wall | 32 B | 61 | 0.39 | 35.93 | 50.92 |
| Wood wall | 64 B | 47 | 0.53 | 39.55 | 60.02 |
This table makes the main problem obvious. The lower RTT at 115200 was real for packets that succeeded, but the system was failing on an unacceptably large share of the larger packets. That means the apparent latency advantage was not usable in practice.
The striking part is that the 115200 failure pattern is much more payload-dependent than distance-dependent. Even at 1 m, packet loss rose from 5% at 1 byte to 57% at 64 bytes. That strongly suggests the dominant limitation was the local serial implementation, not the radio path.
Plots and discussion
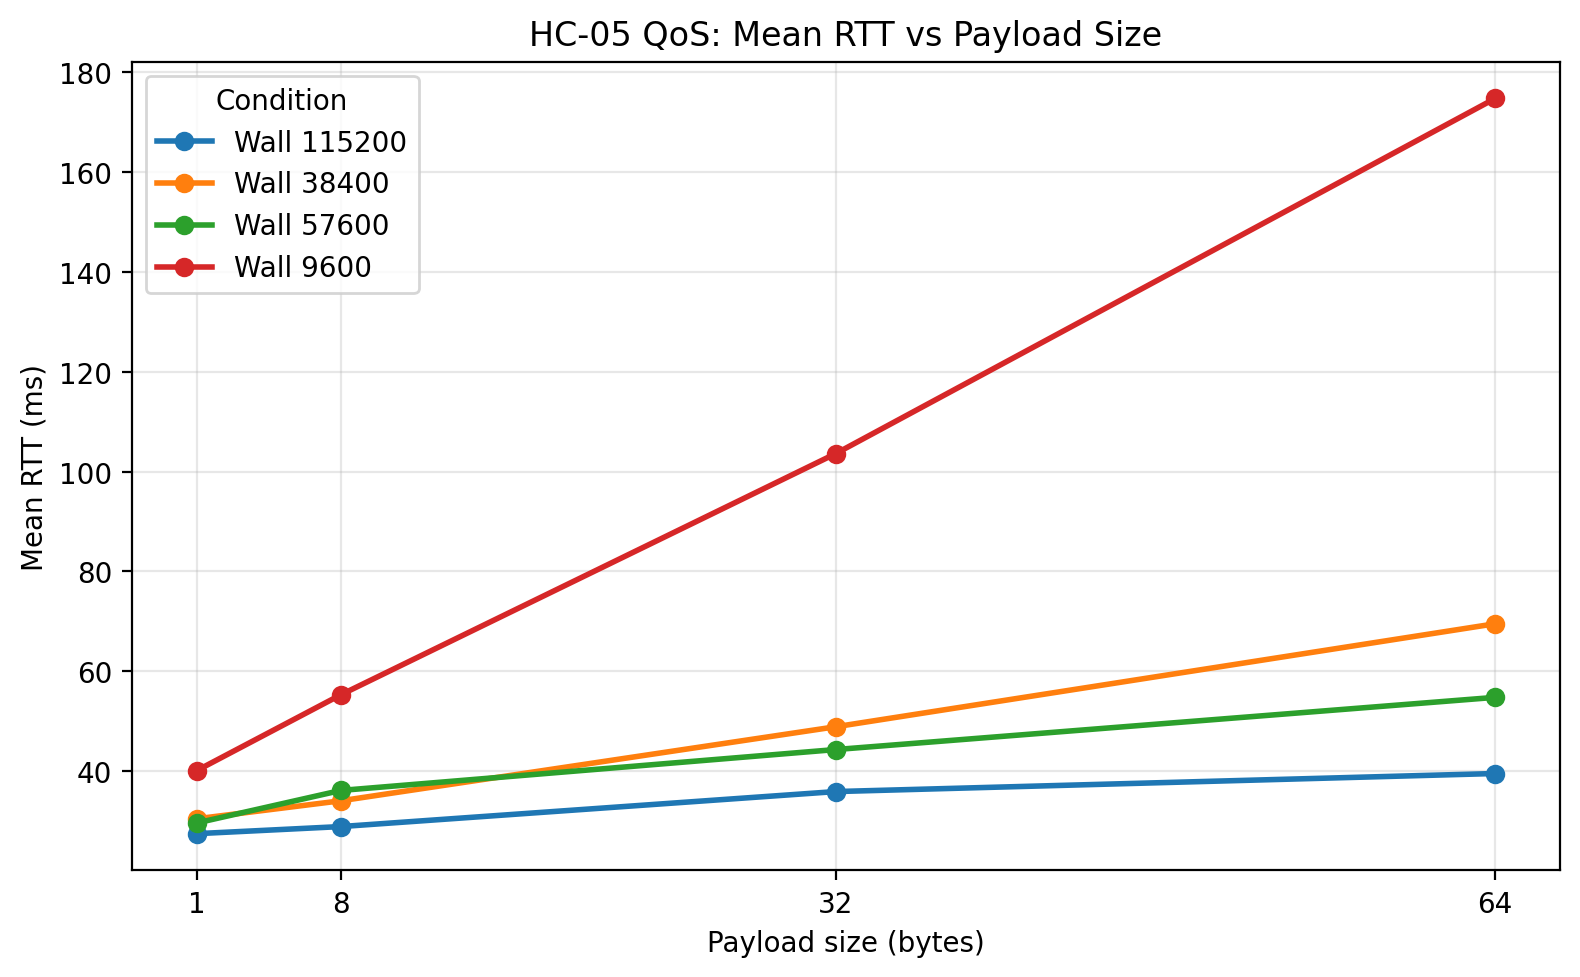
1 m: Mean RTT vs payload size
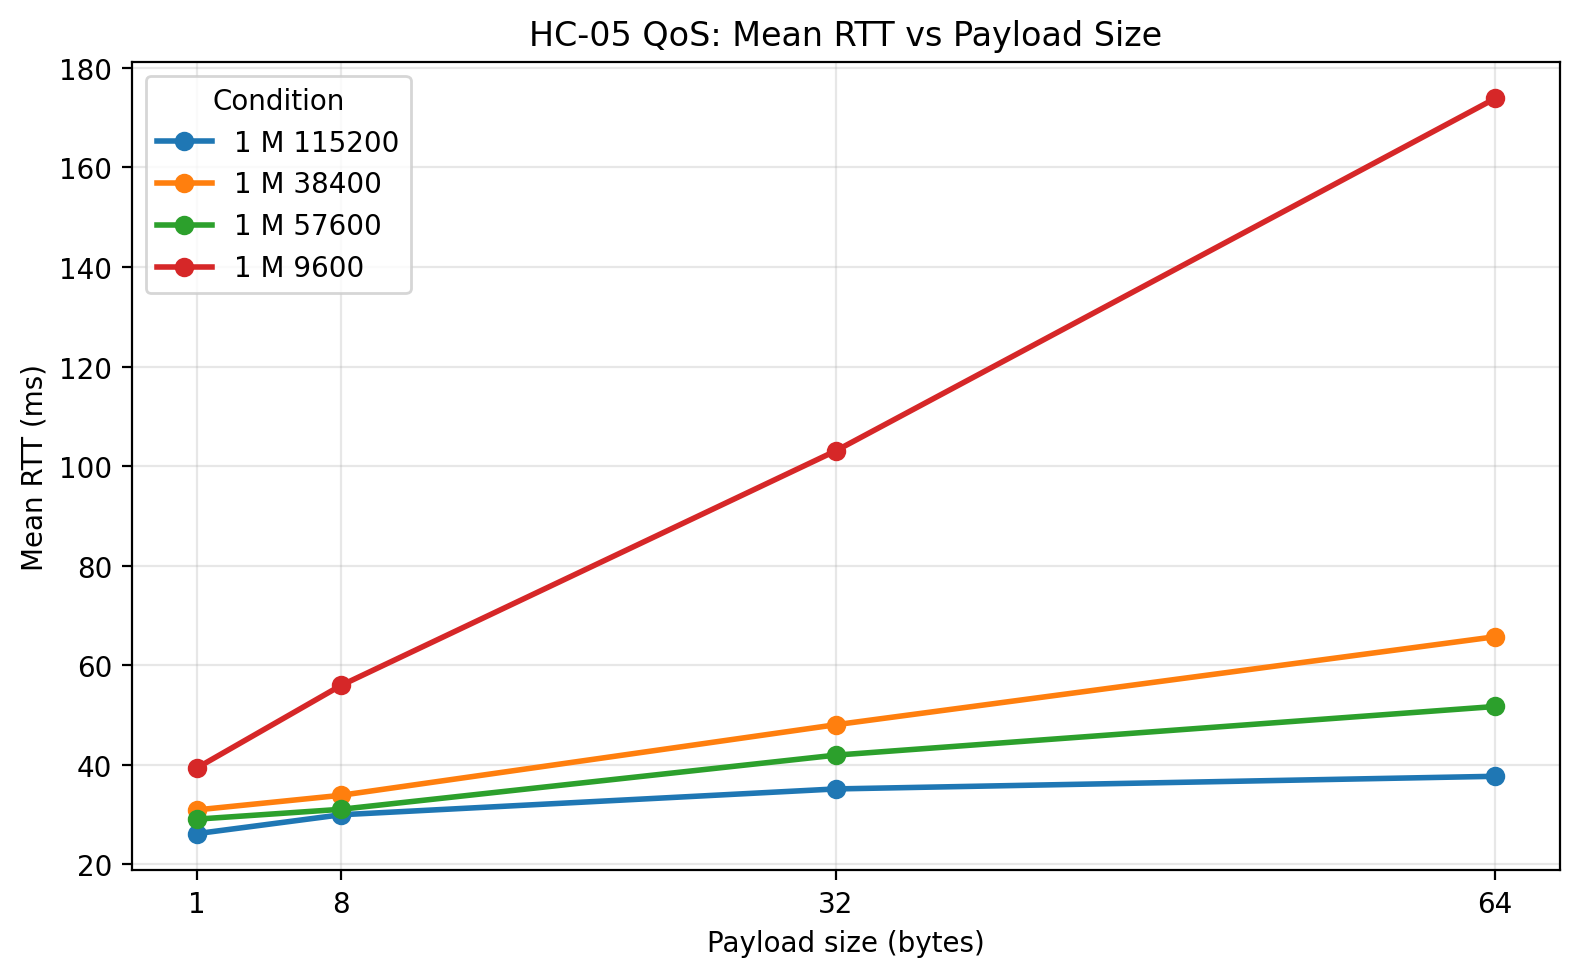
At 1 m, the mean RTT plot shows the basic UART-rate story very clearly. 9600 is much slower than every other tested rate across all payload sizes. 38400 and 57600 both reduce latency substantially, and 57600 is consistently the fastest of the zero-loss configurations. 115200 sits lowest on the plot, but that visual is deceptive unless it is read together with the loss and goodput plots. The line for 115200 represents only the packets that actually returned successfully.
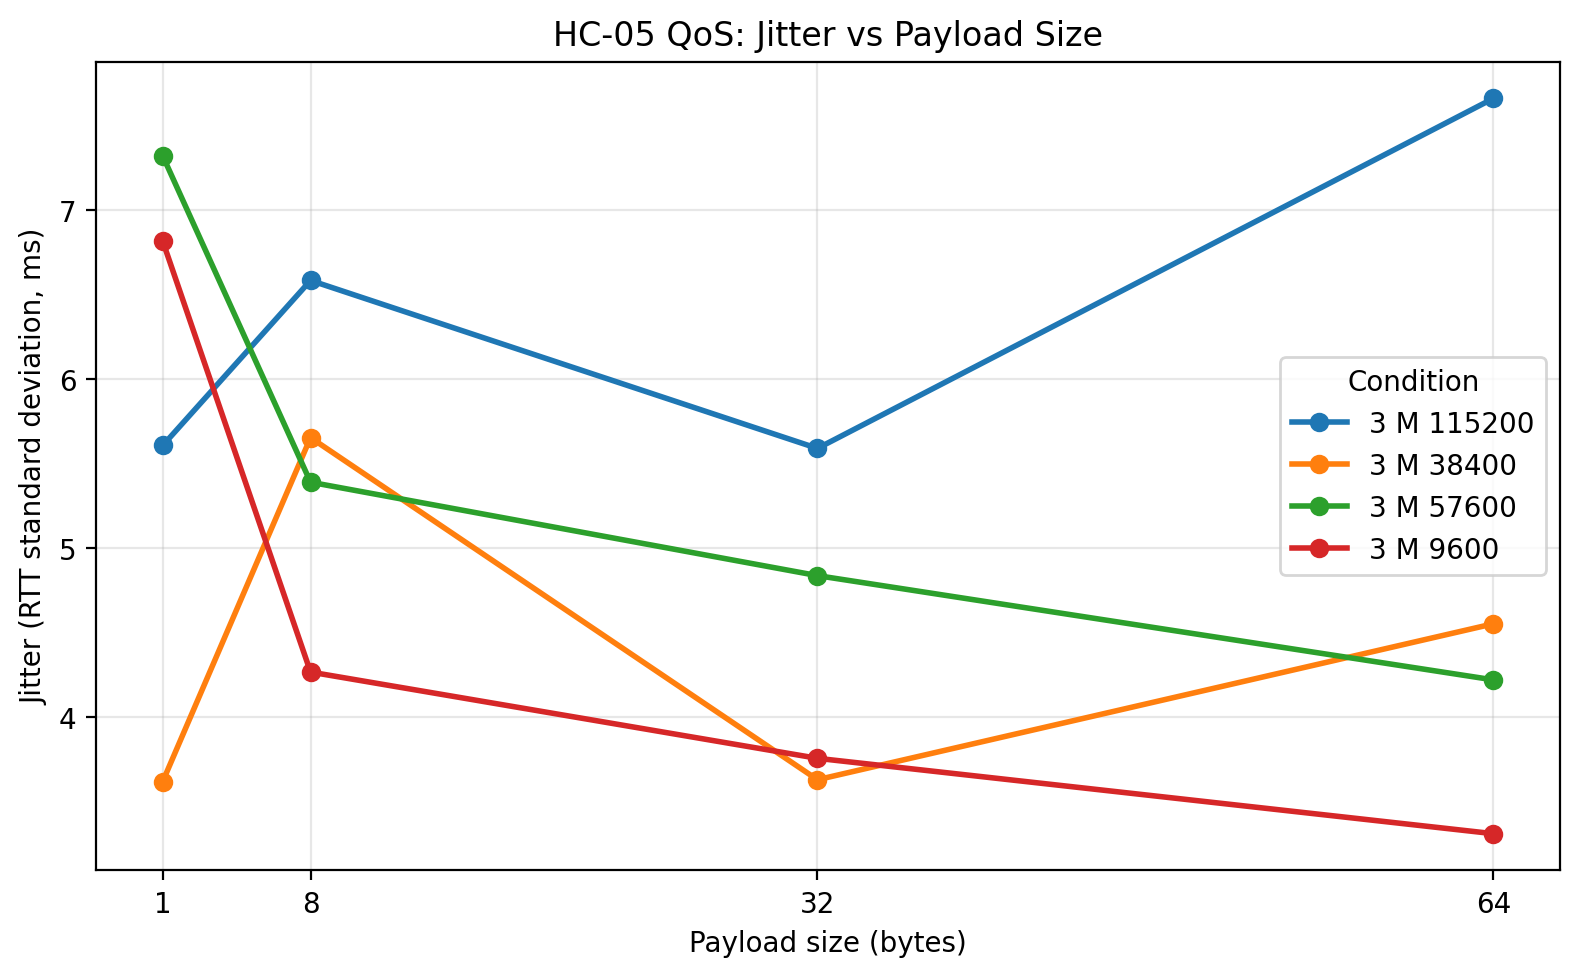
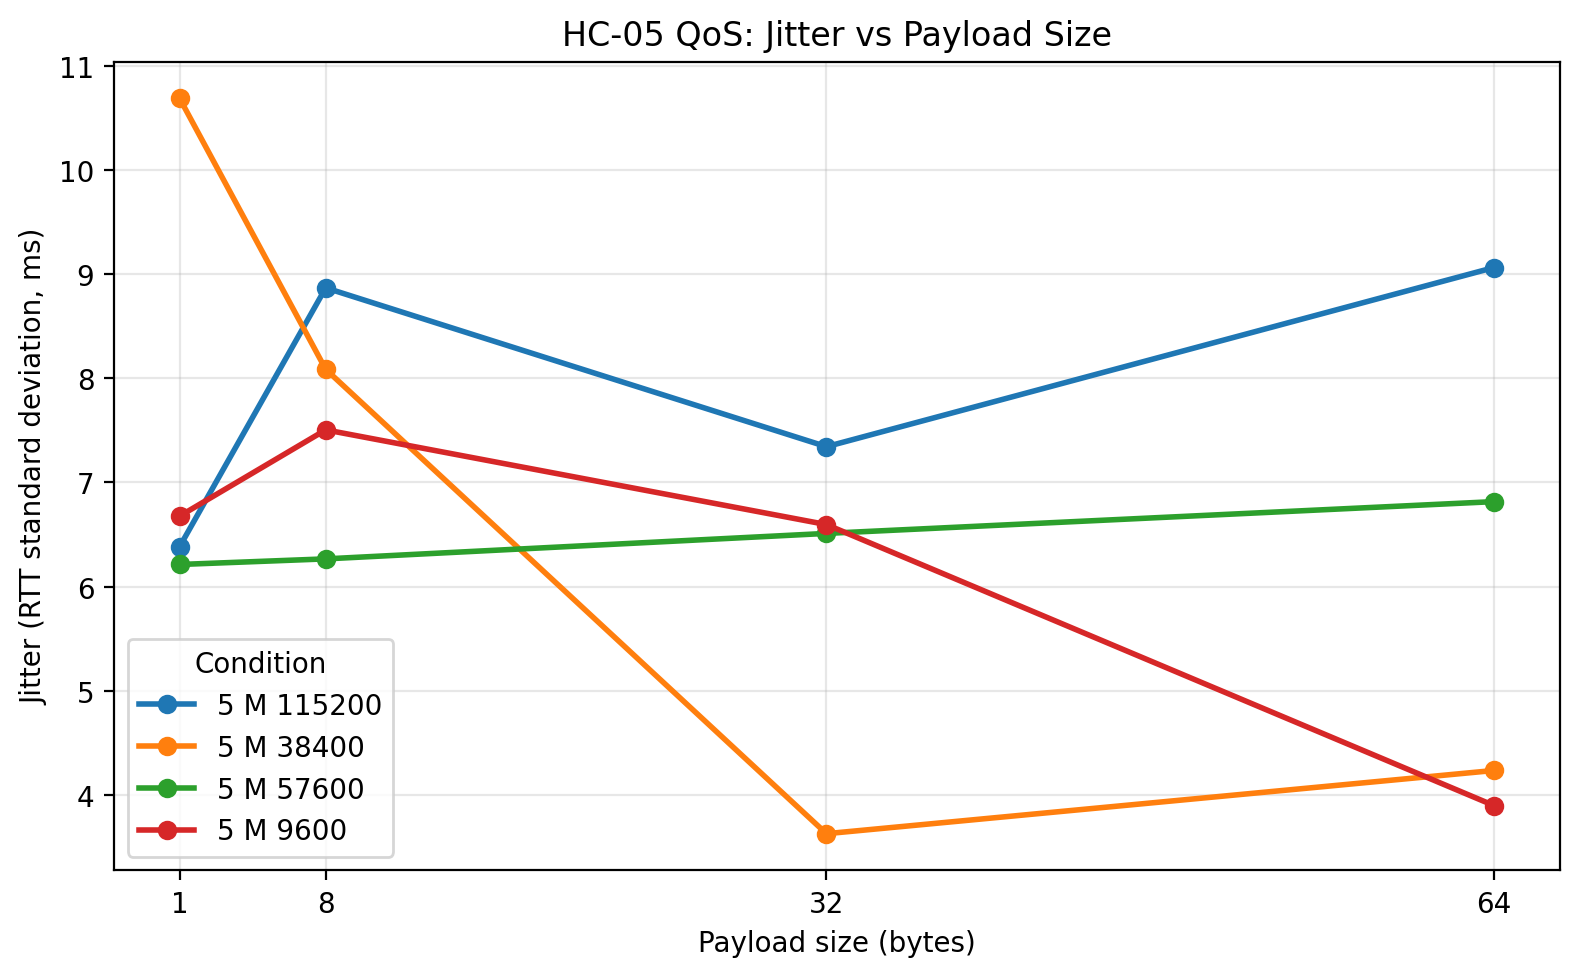
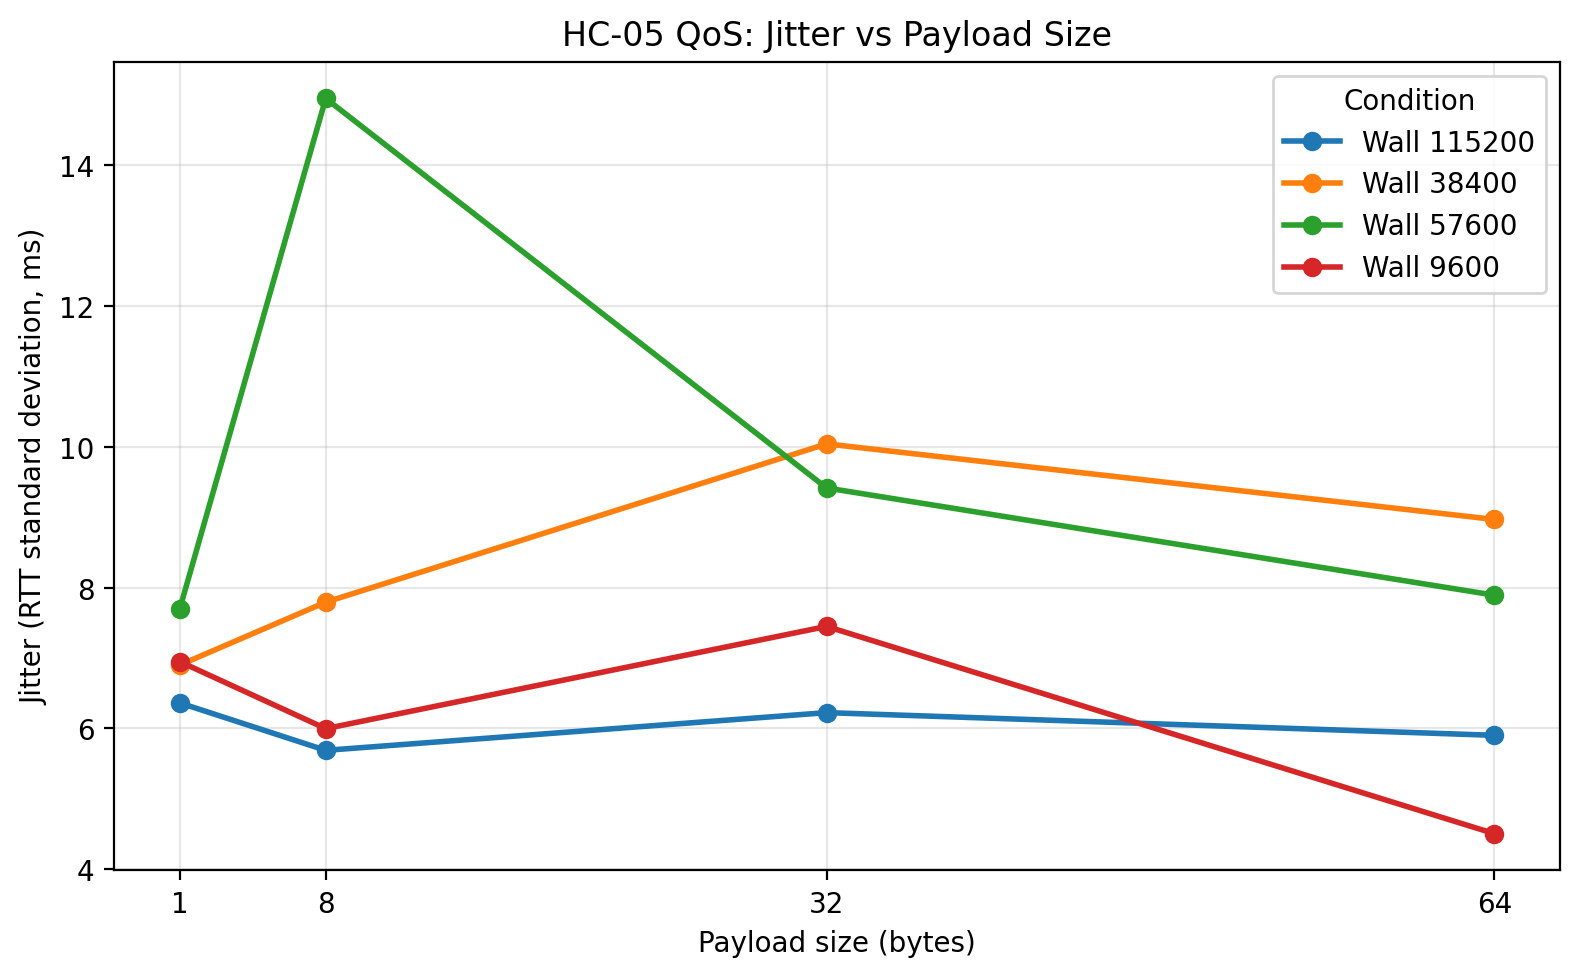
1 m: Jitter vs payload size
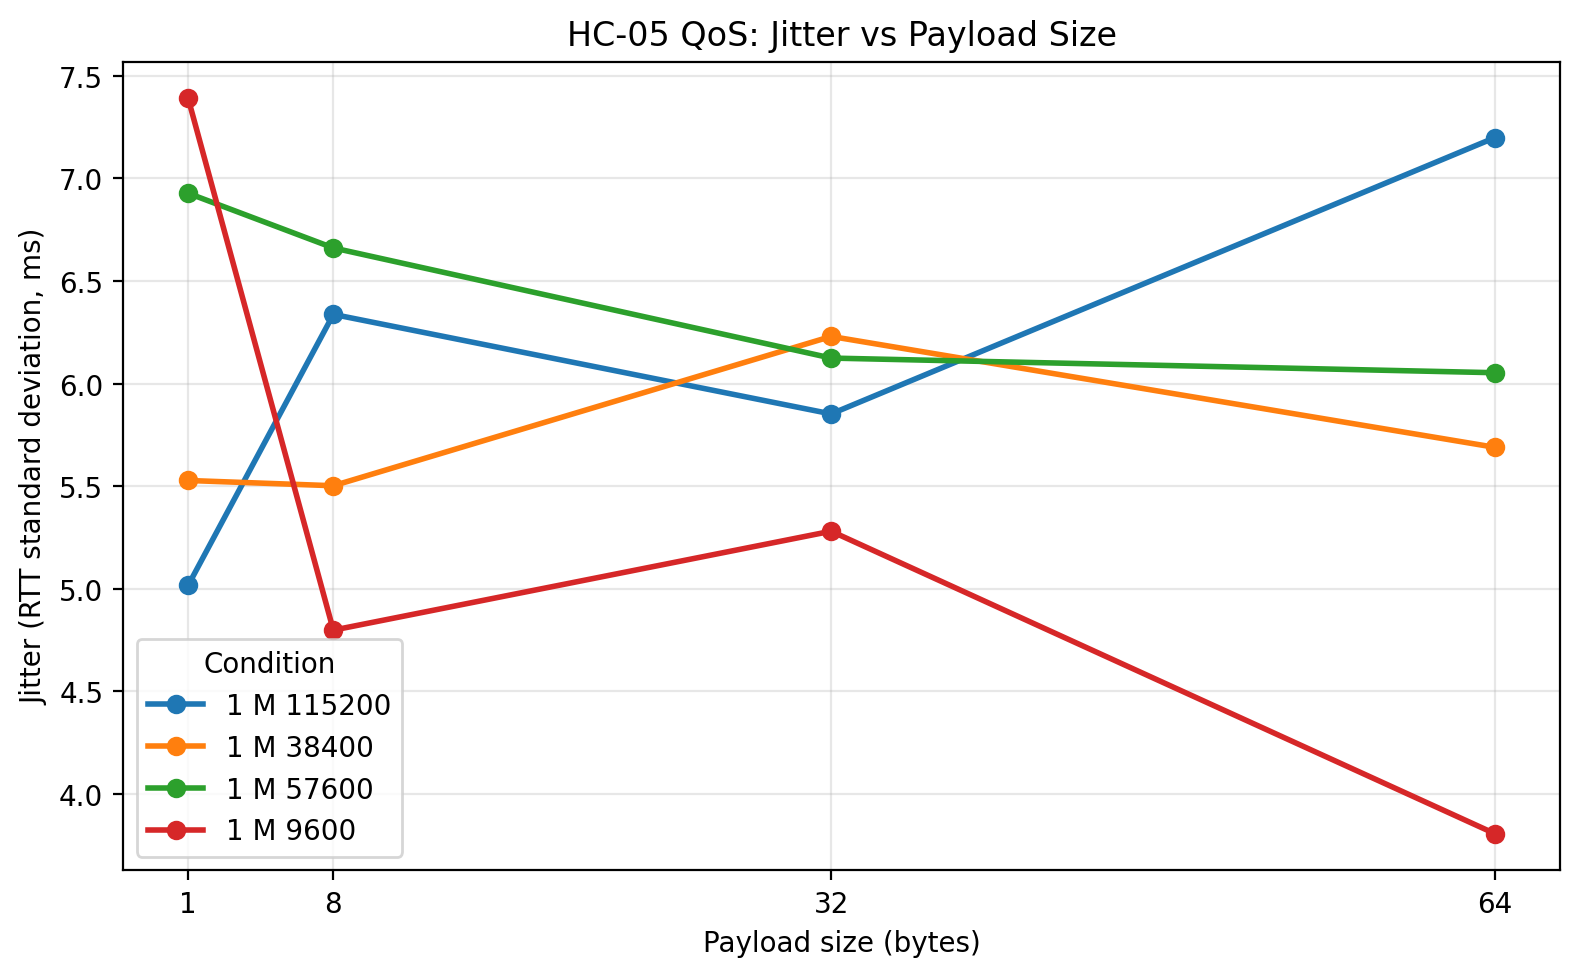
The 1 m jitter plot shows that increasing the UART rate did not simply make the system more unstable. For 38400 and 57600, jitter remained modest even as RTT improved. The more unstable behavior appears only at 115200, and even there the biggest problem is not merely jitter but the large number of missing packets. This is a good example of why jitter and loss need to be interpreted together.
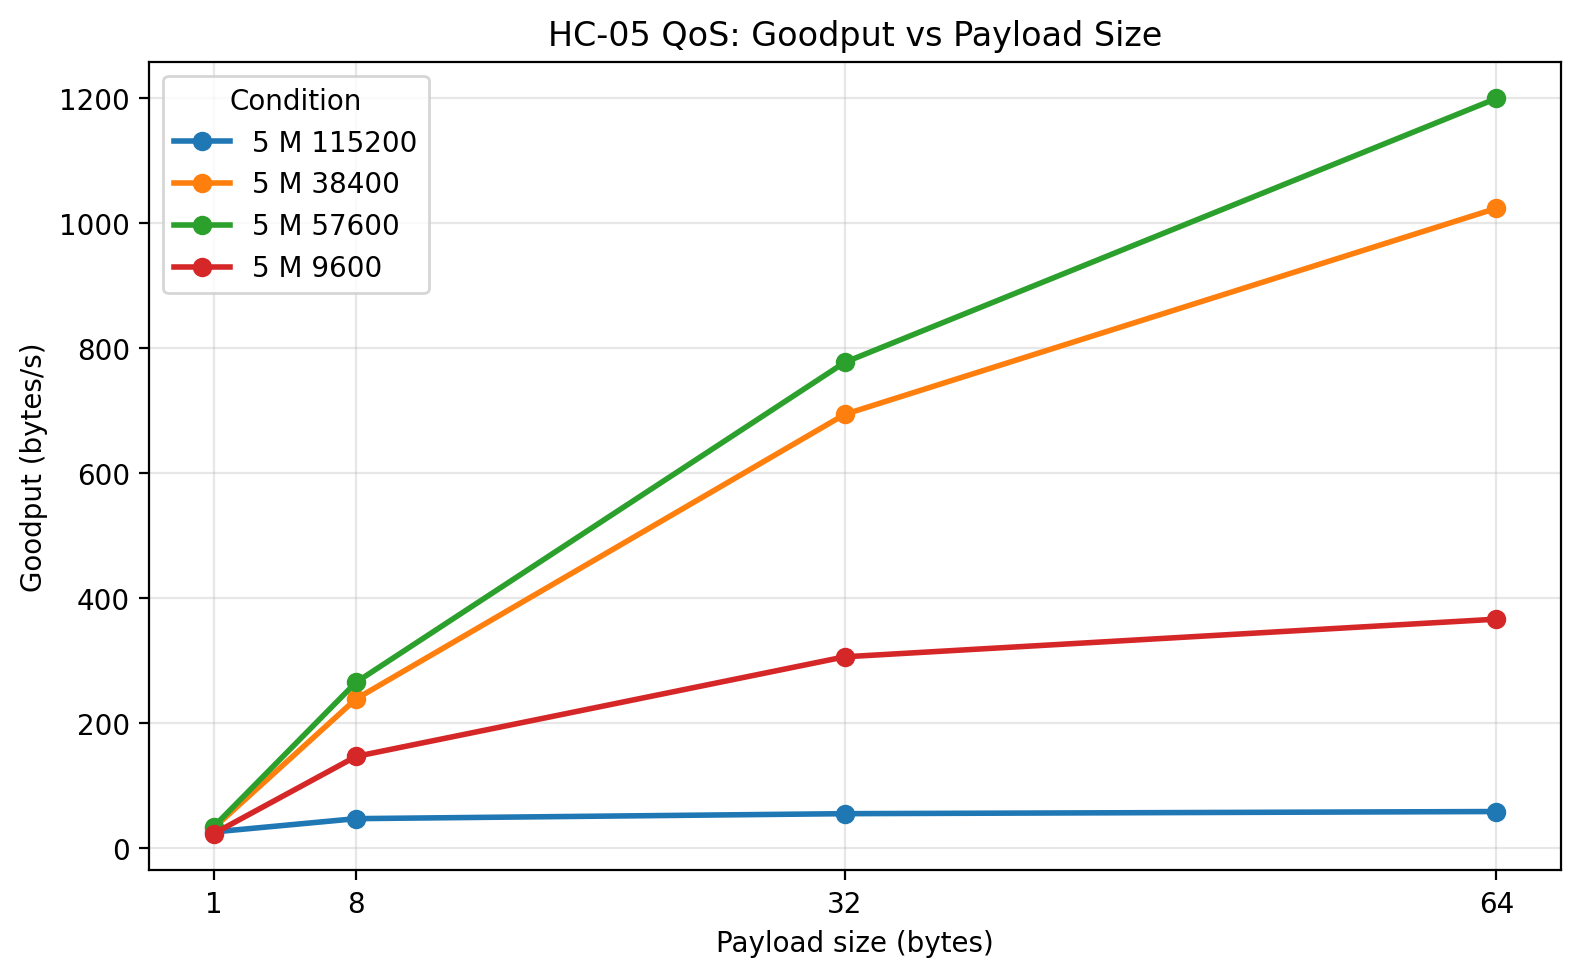
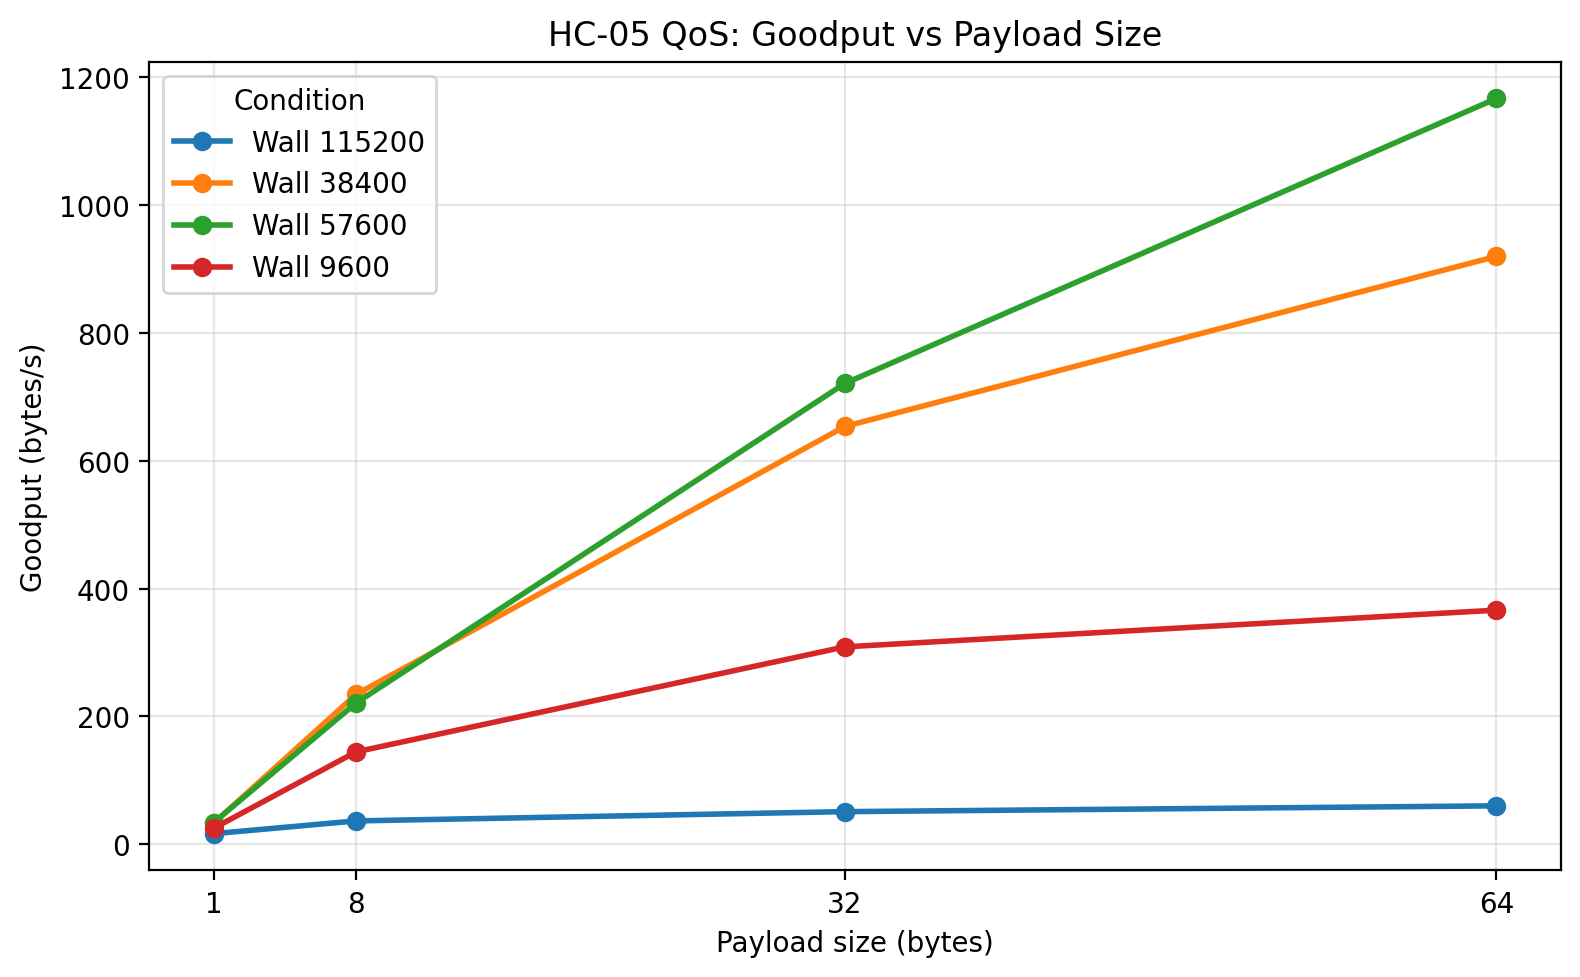
1 m: Goodput vs payload size
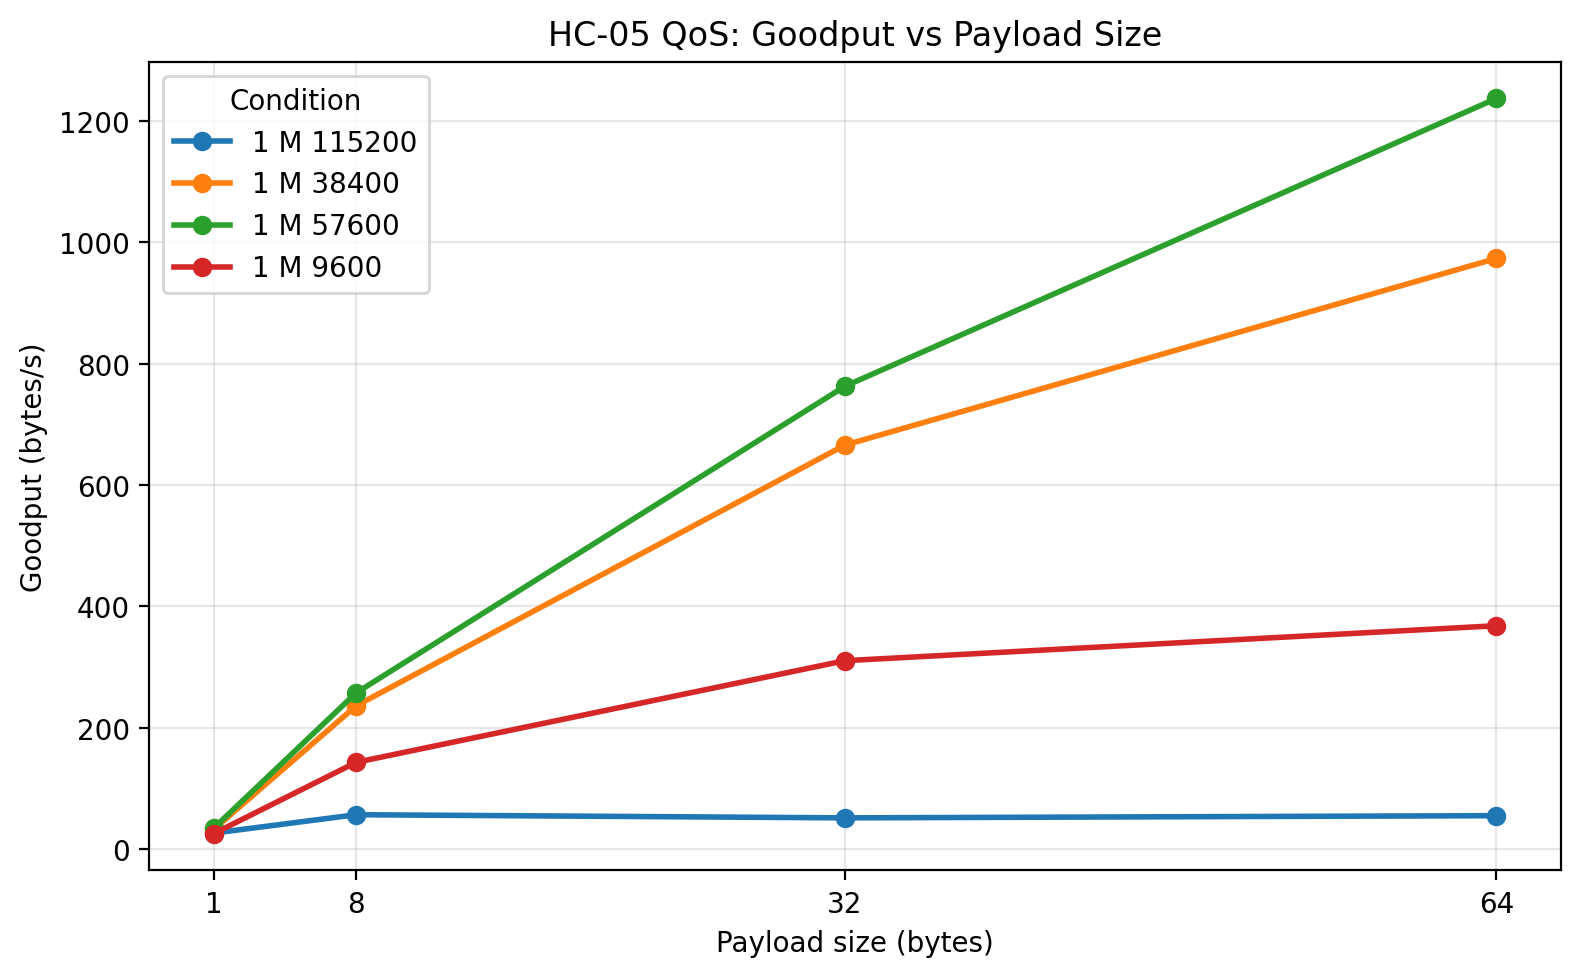
This is one of the most informative plots in the entire study. Goodput increases with payload size for the stable UART rates, which is exactly what should happen as fixed per-packet overhead is amortized over more useful bytes. 57600 emerges as the clear winner, with 38400 close behind. 9600 is far lower. The remarkable point is that 115200, despite its low RTT on successful packets, collapses in goodput because too many packets fail. This is the clearest single plot showing why lower successful-packet RTT does not automatically imply better system performance.
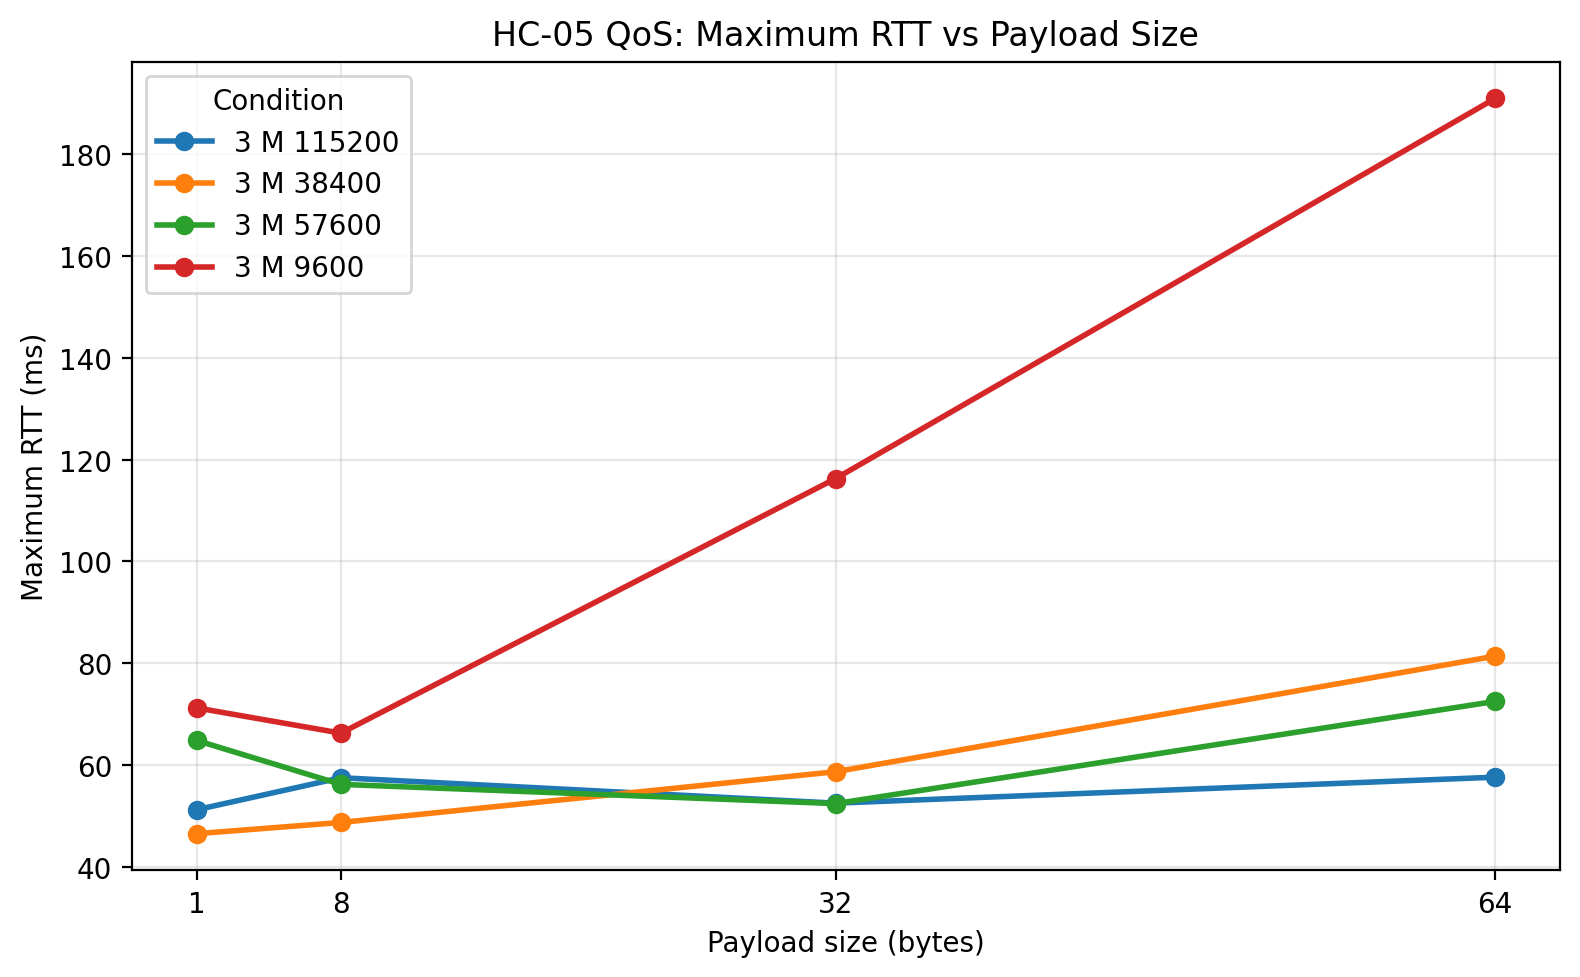
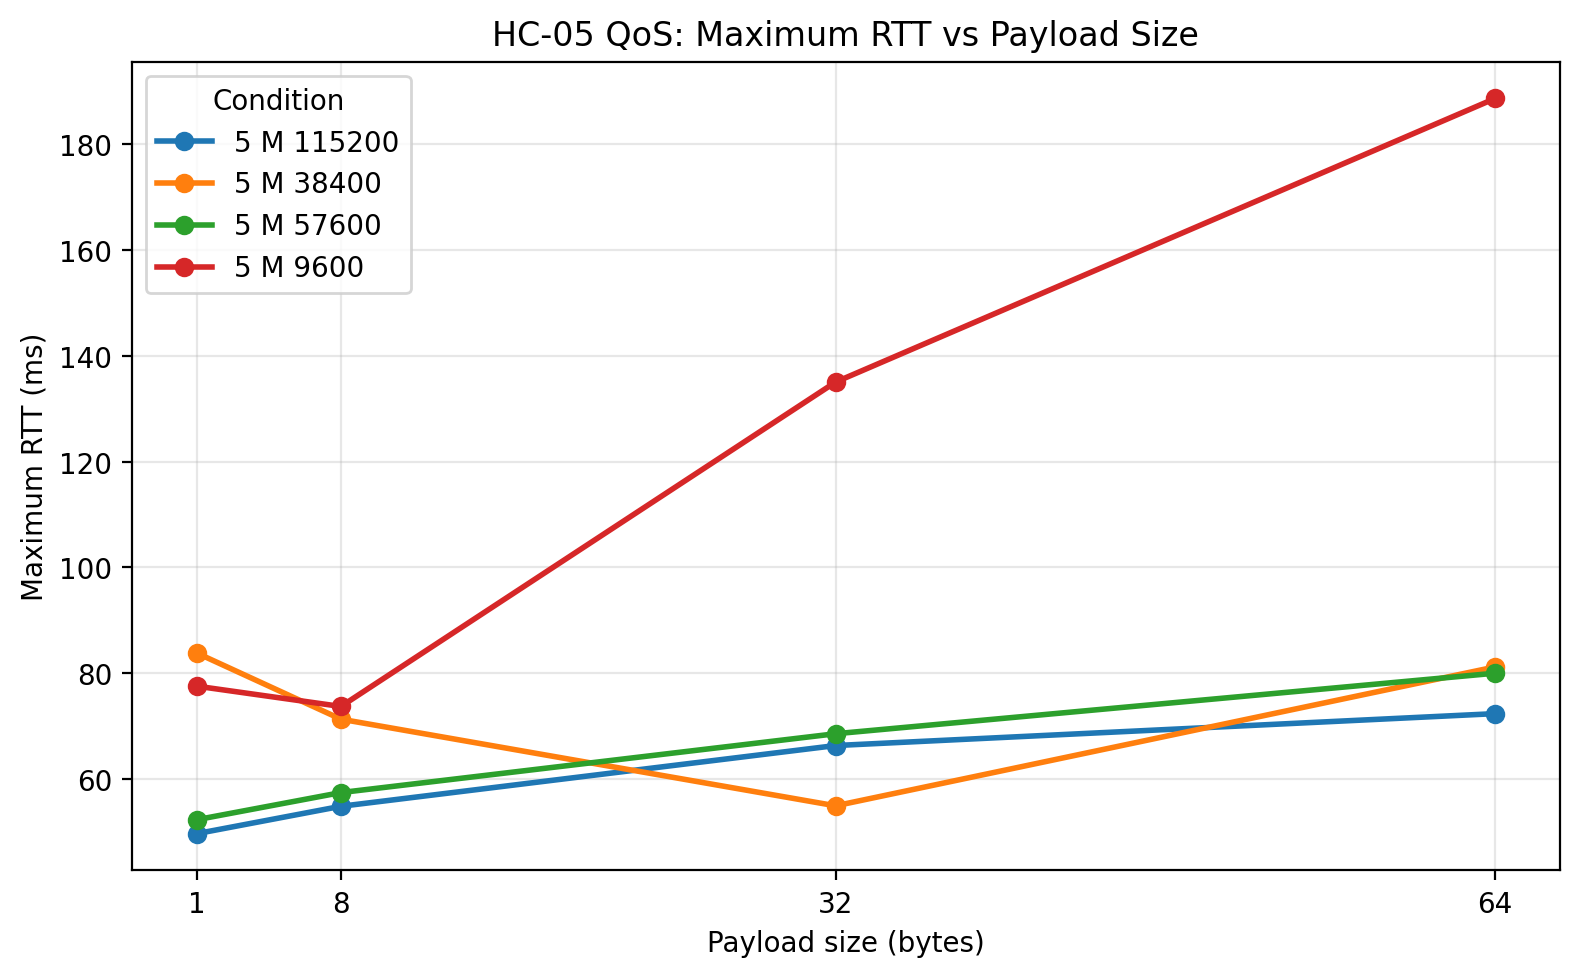
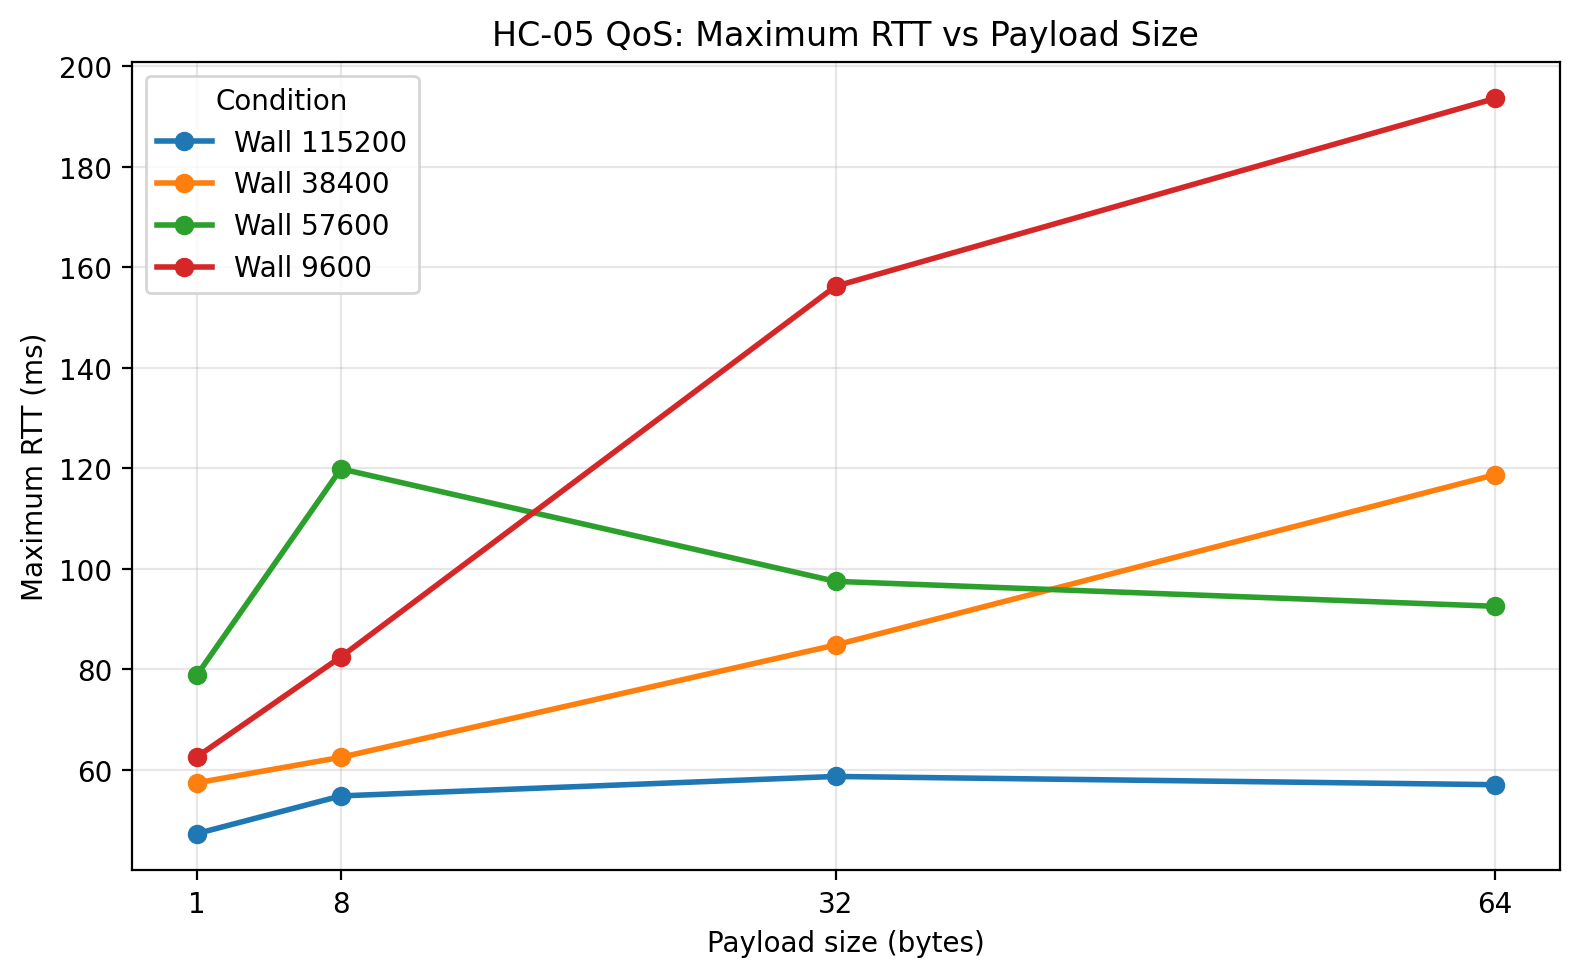
1 m: Maximum RTT vs payload size
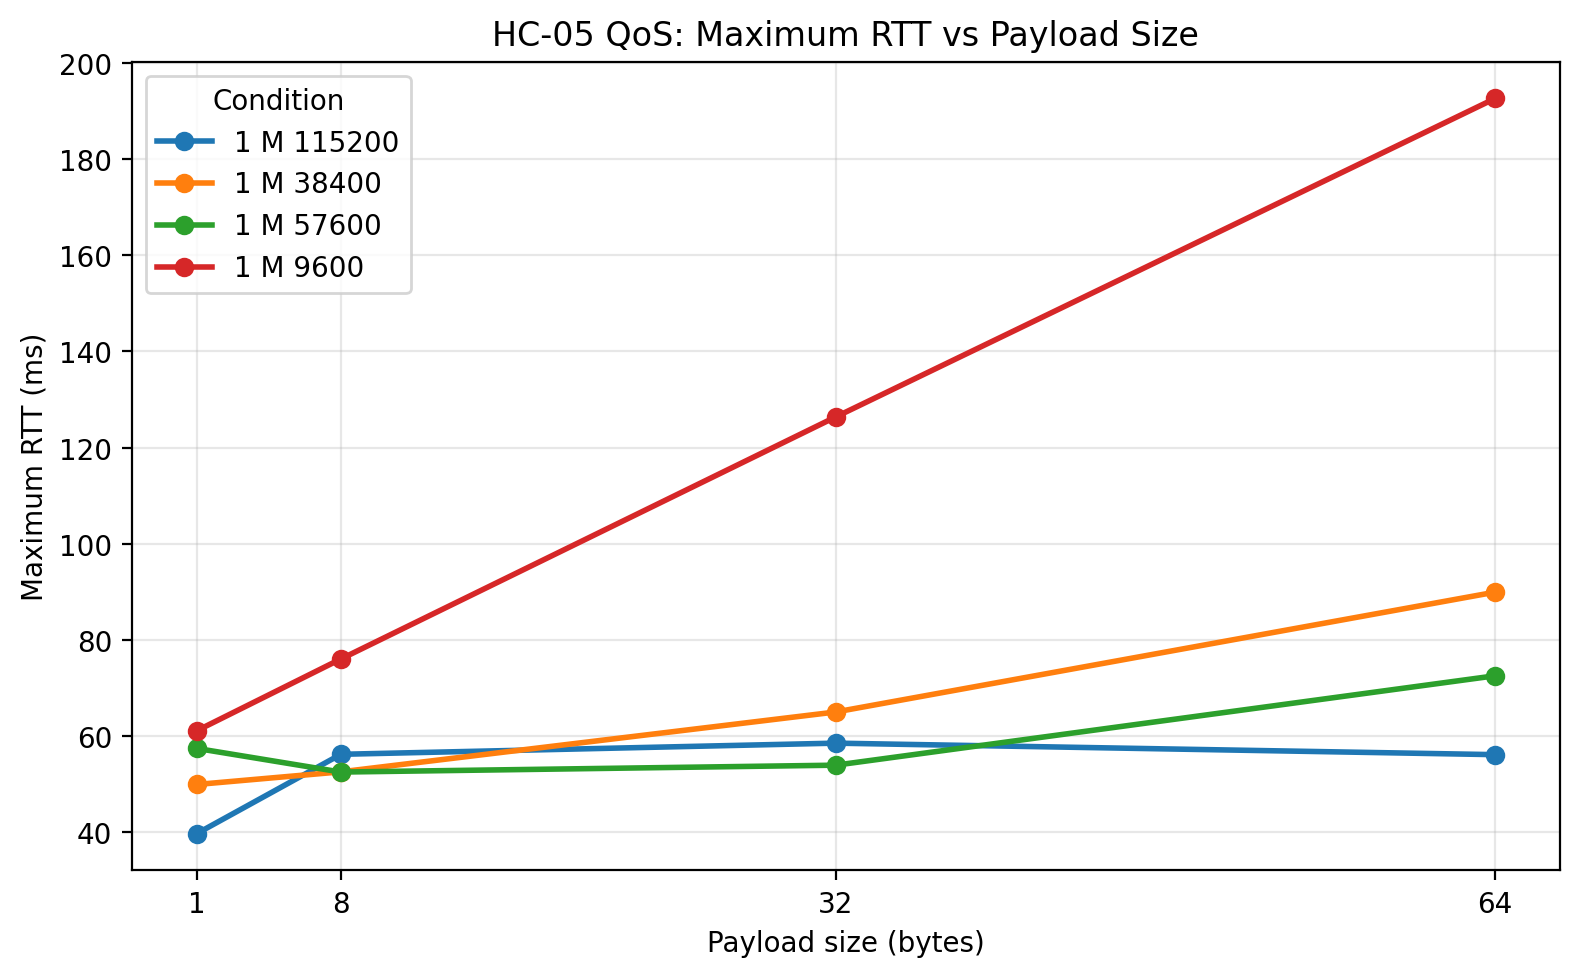
The maximum RTT plot shows how wide the latency envelope becomes. 9600 has the largest worst-case delays among the reliable rates, as expected. 38400 and 57600 bring the worst-case latency down substantially. The 115200 maxima are lower, but again those results apply only to successful packets and therefore cannot be interpreted in isolation.
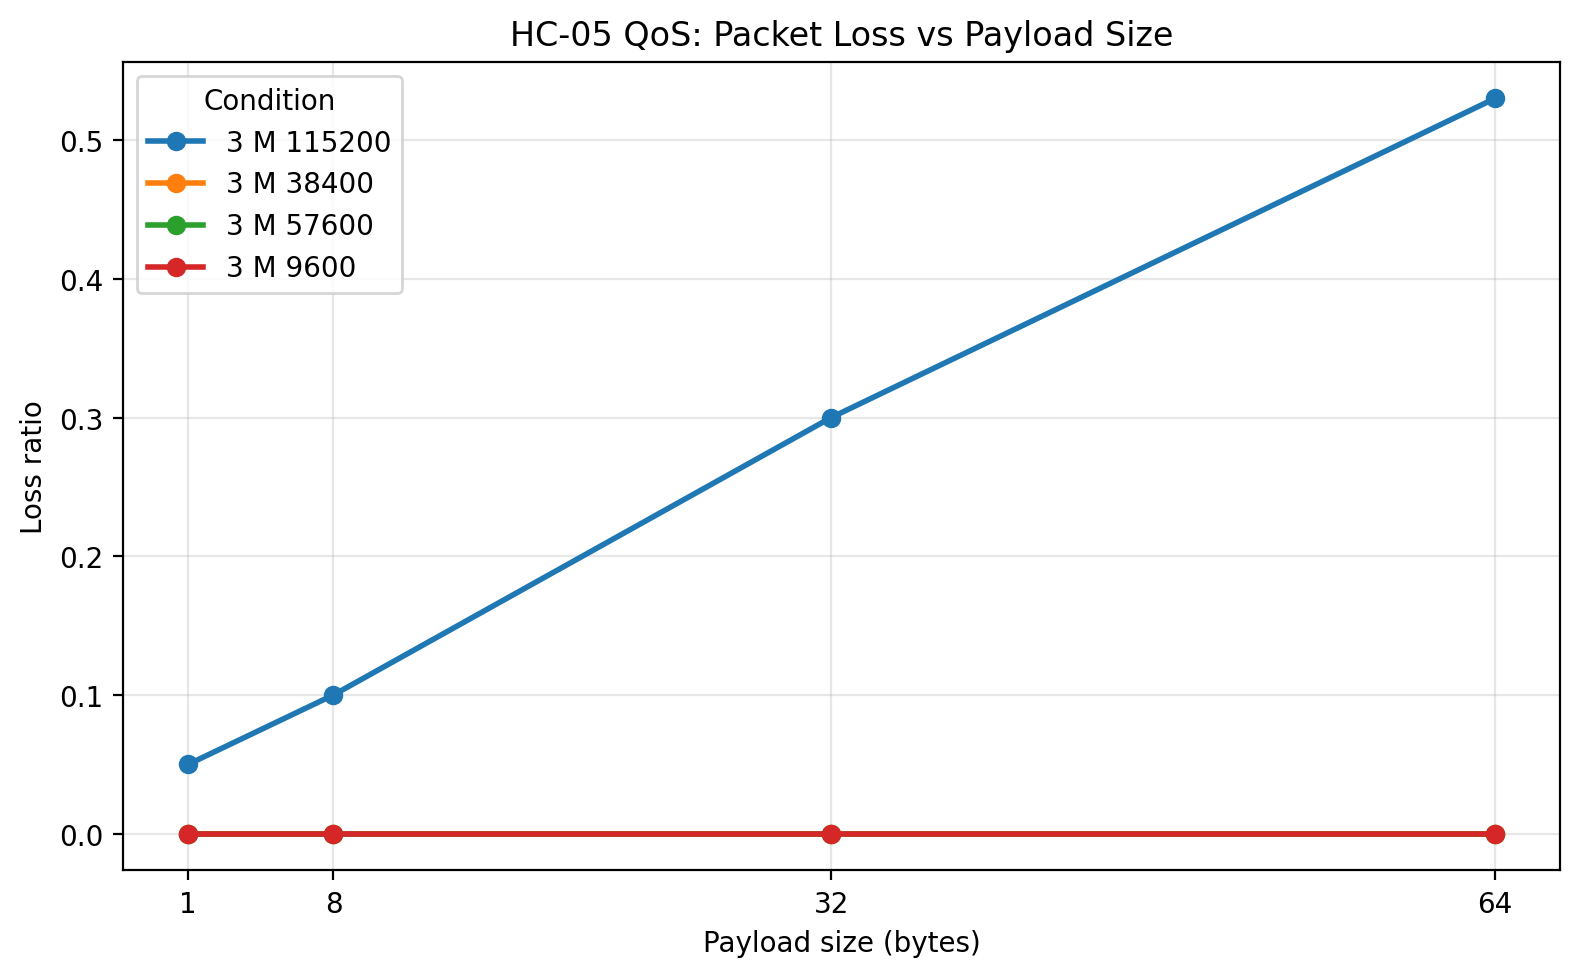
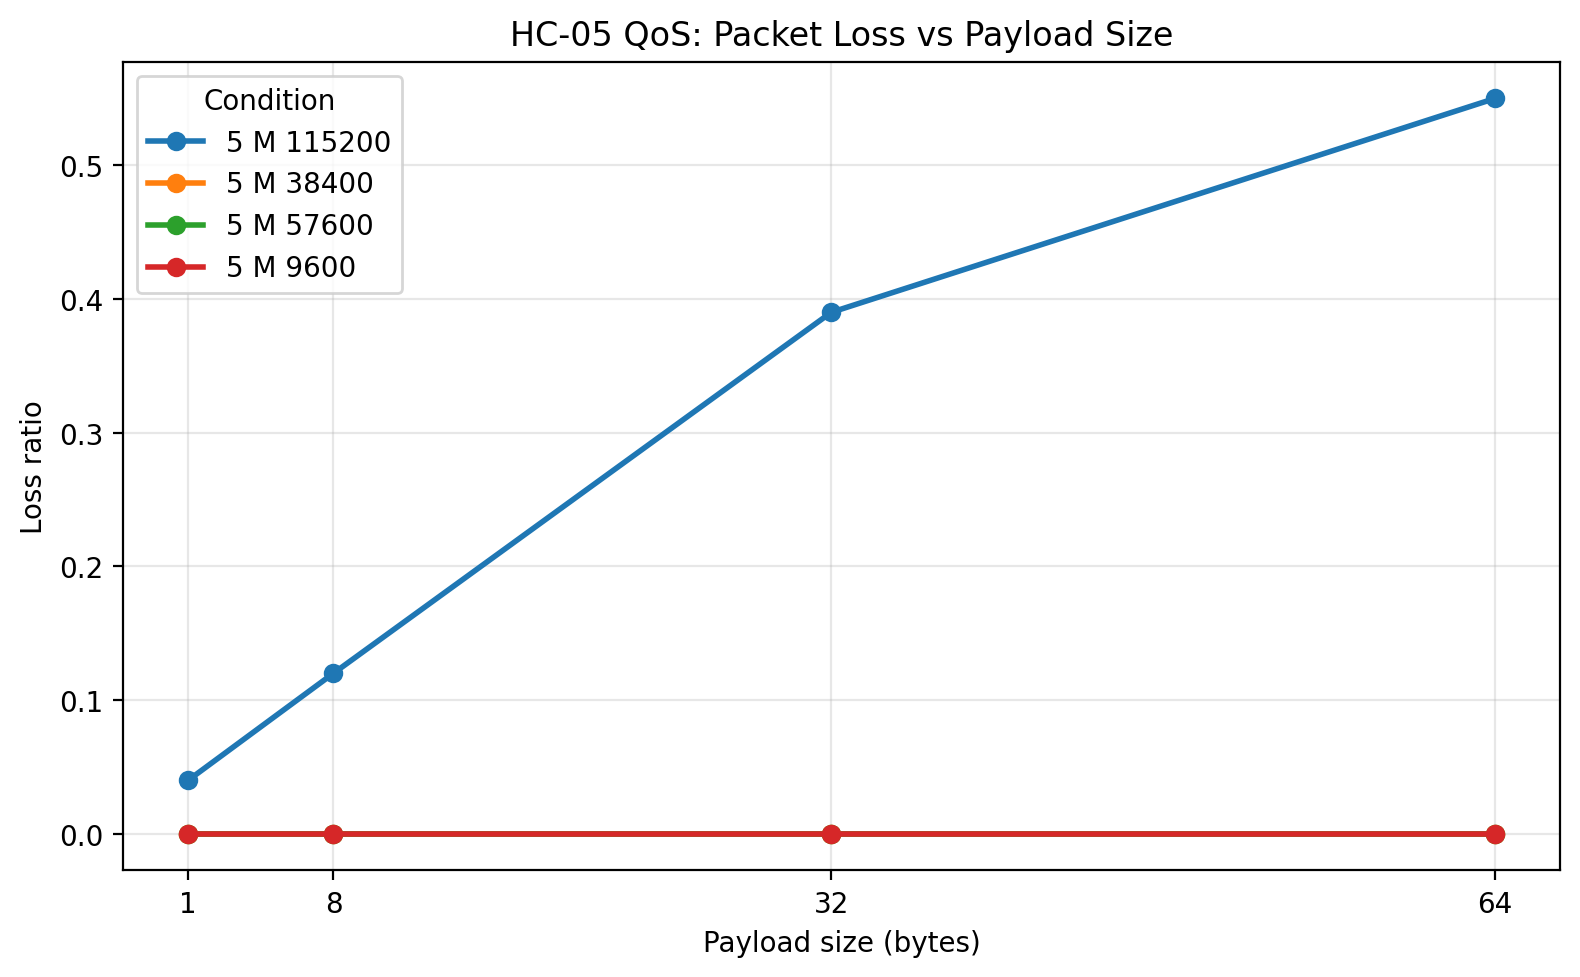
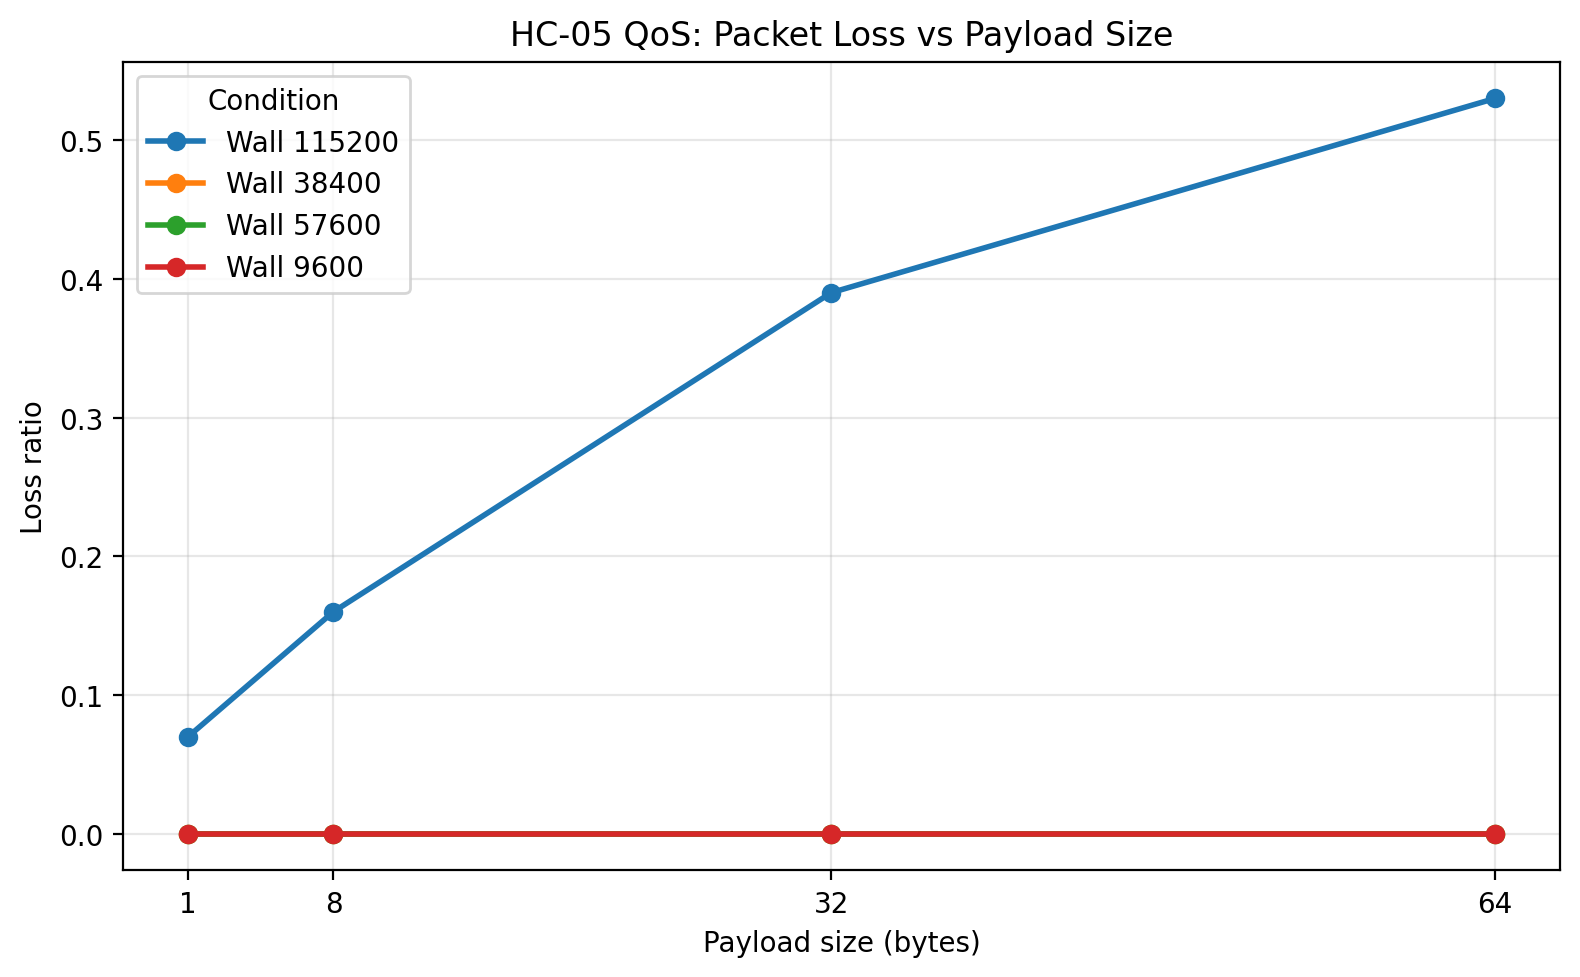
1 m: Loss vs payload size
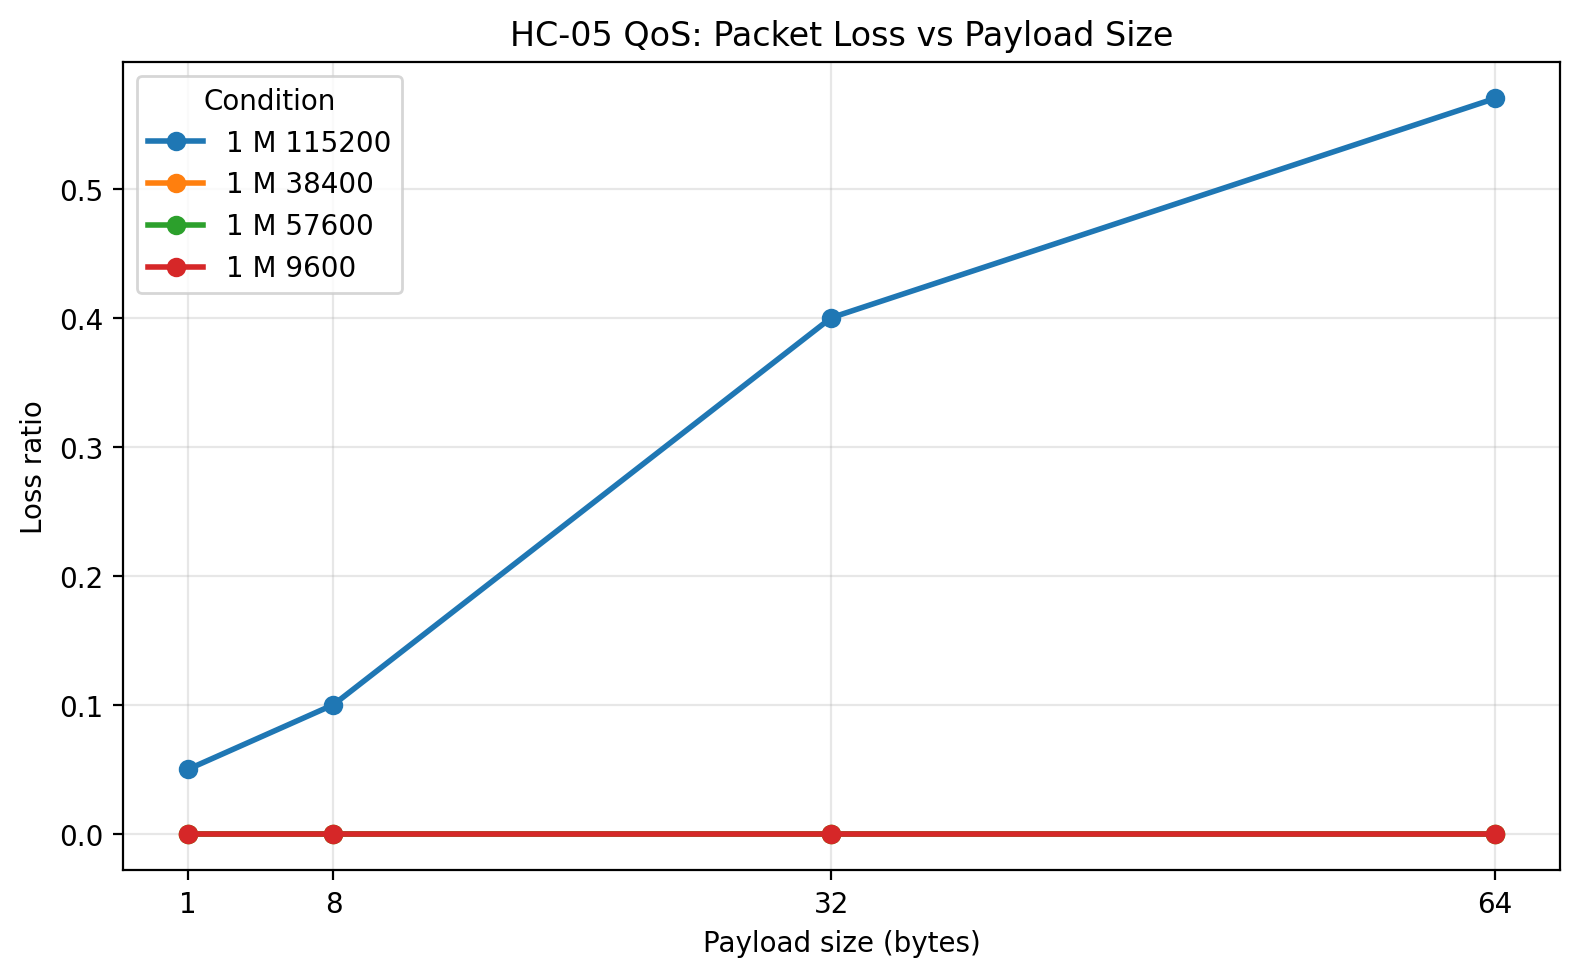
This plot is one of the most decisive in the post. 9600, 38400, and 57600 all stayed at zero loss. 115200 did not. The loss grew with payload size, which is exactly the pattern I would expect if the local serial implementation was being pushed past a comfortable operating region. This plot alone is enough to reject 115200 as the preferred operating point for this platform.
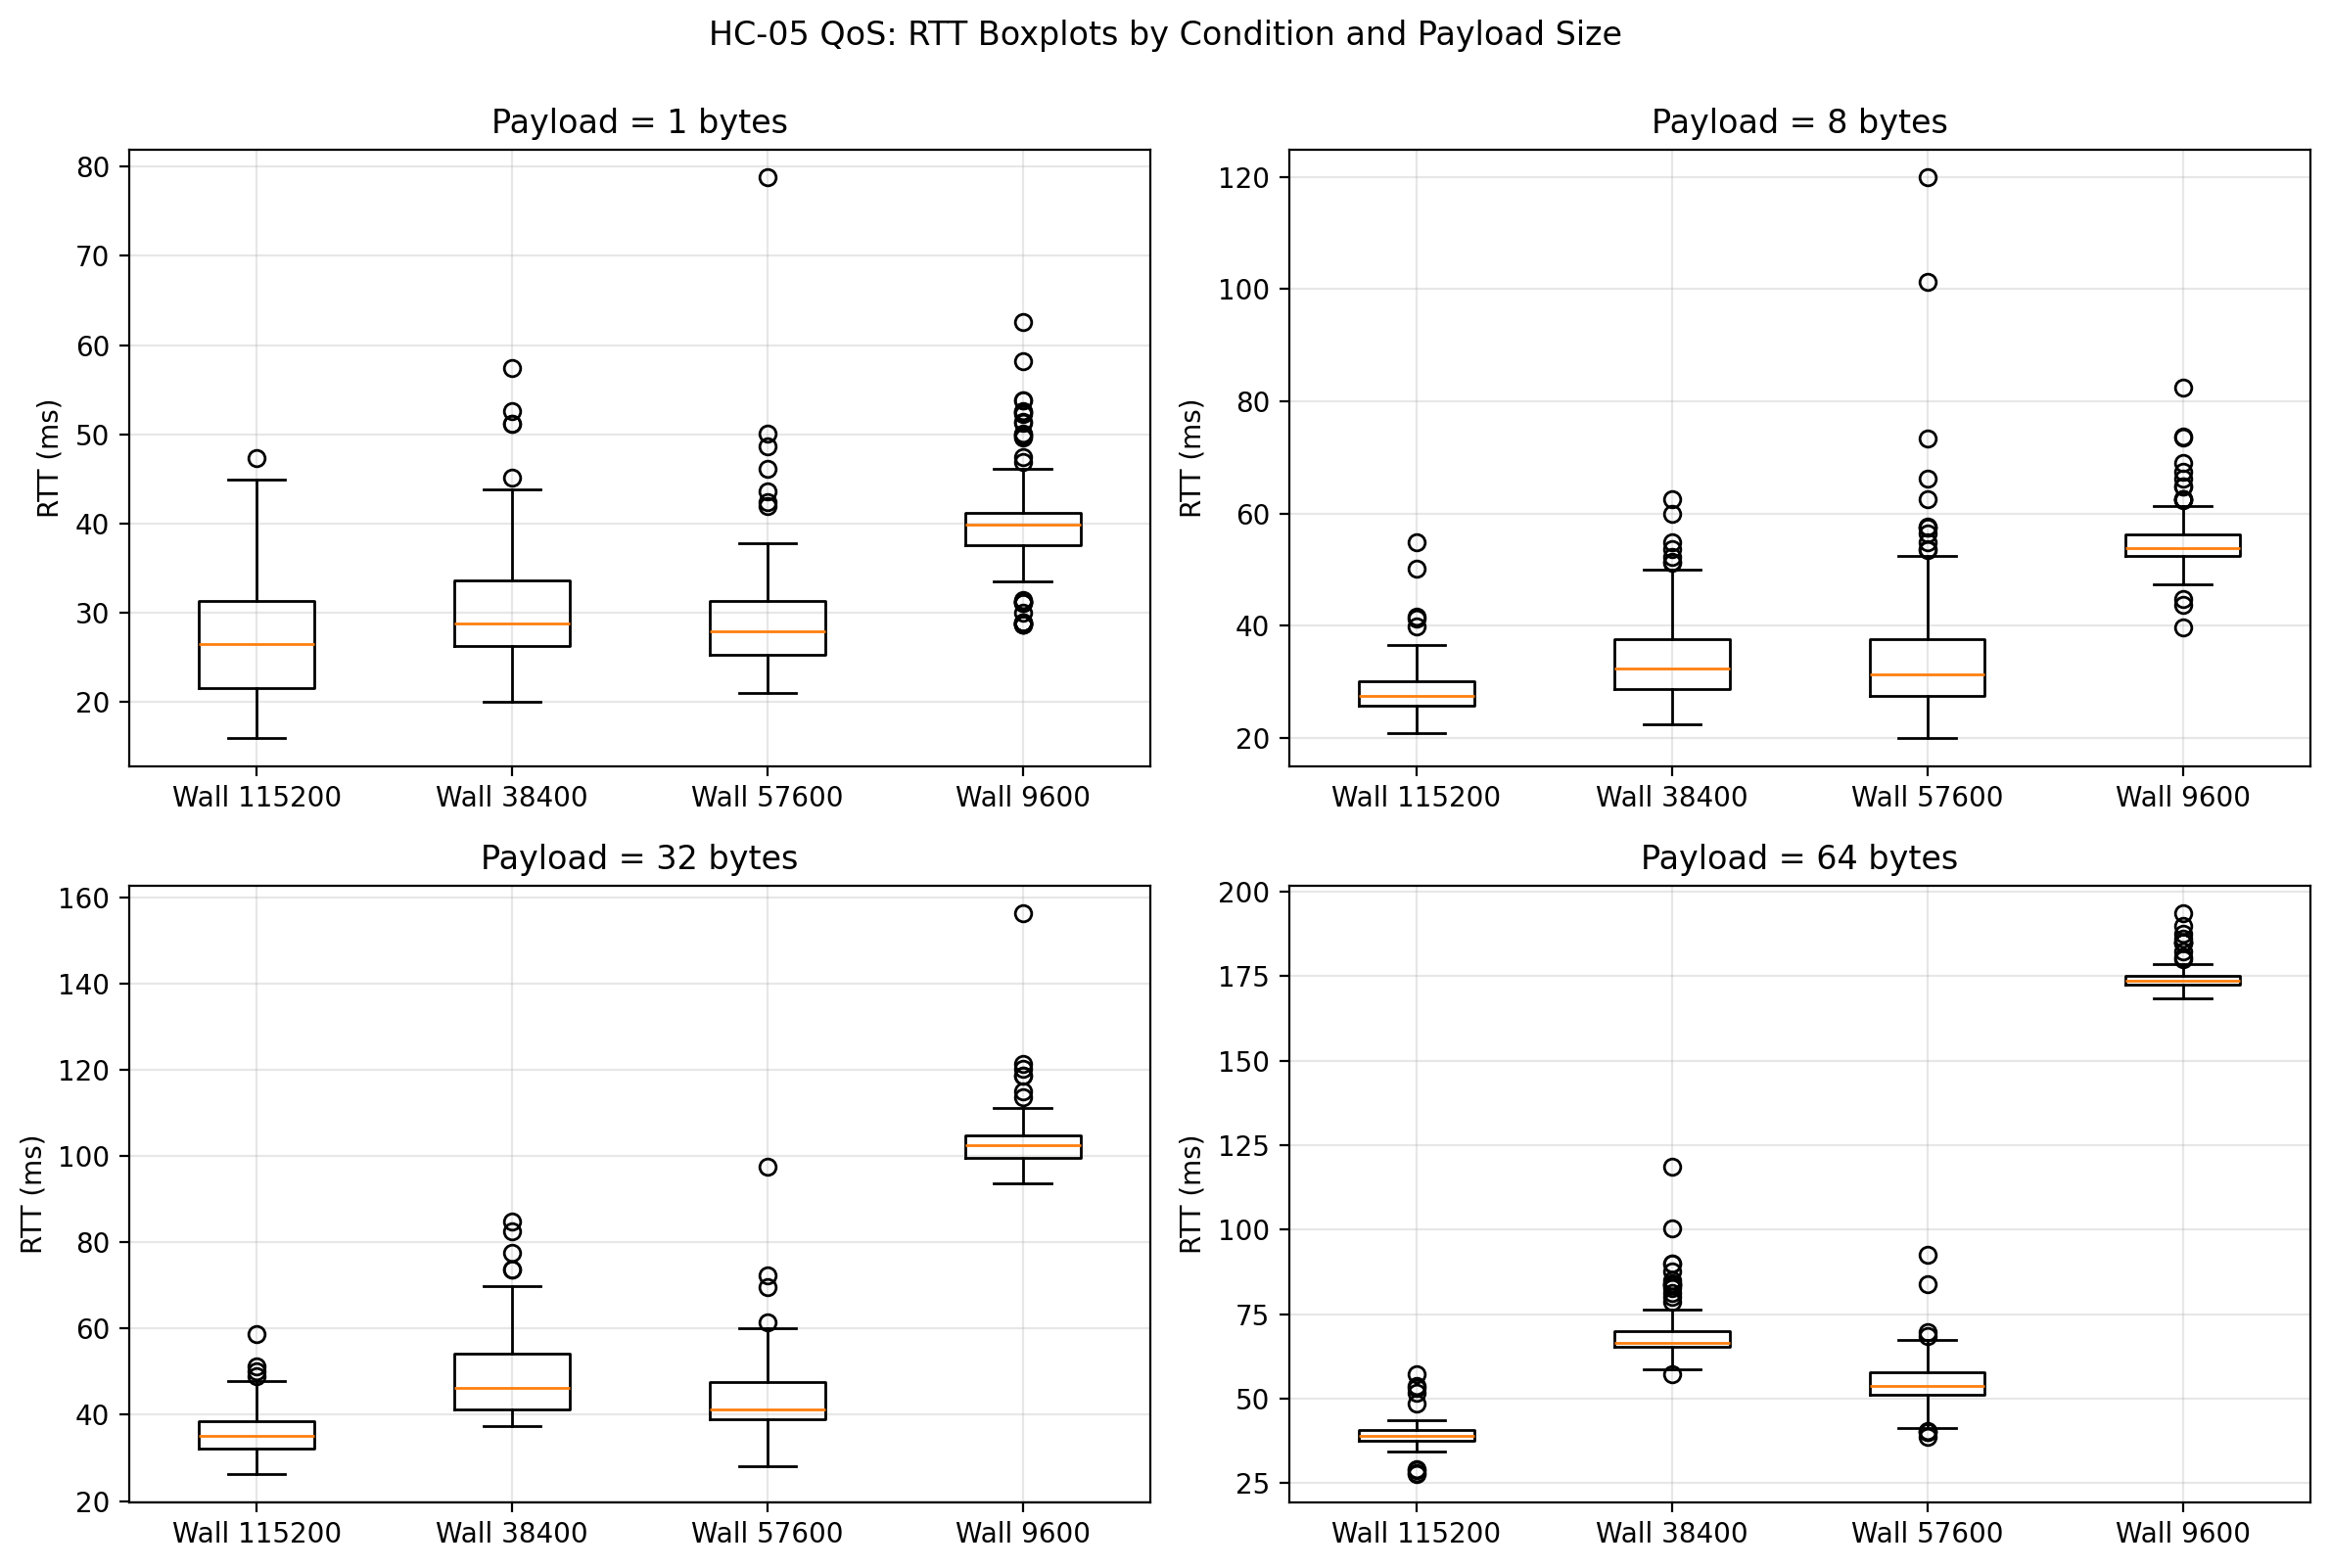
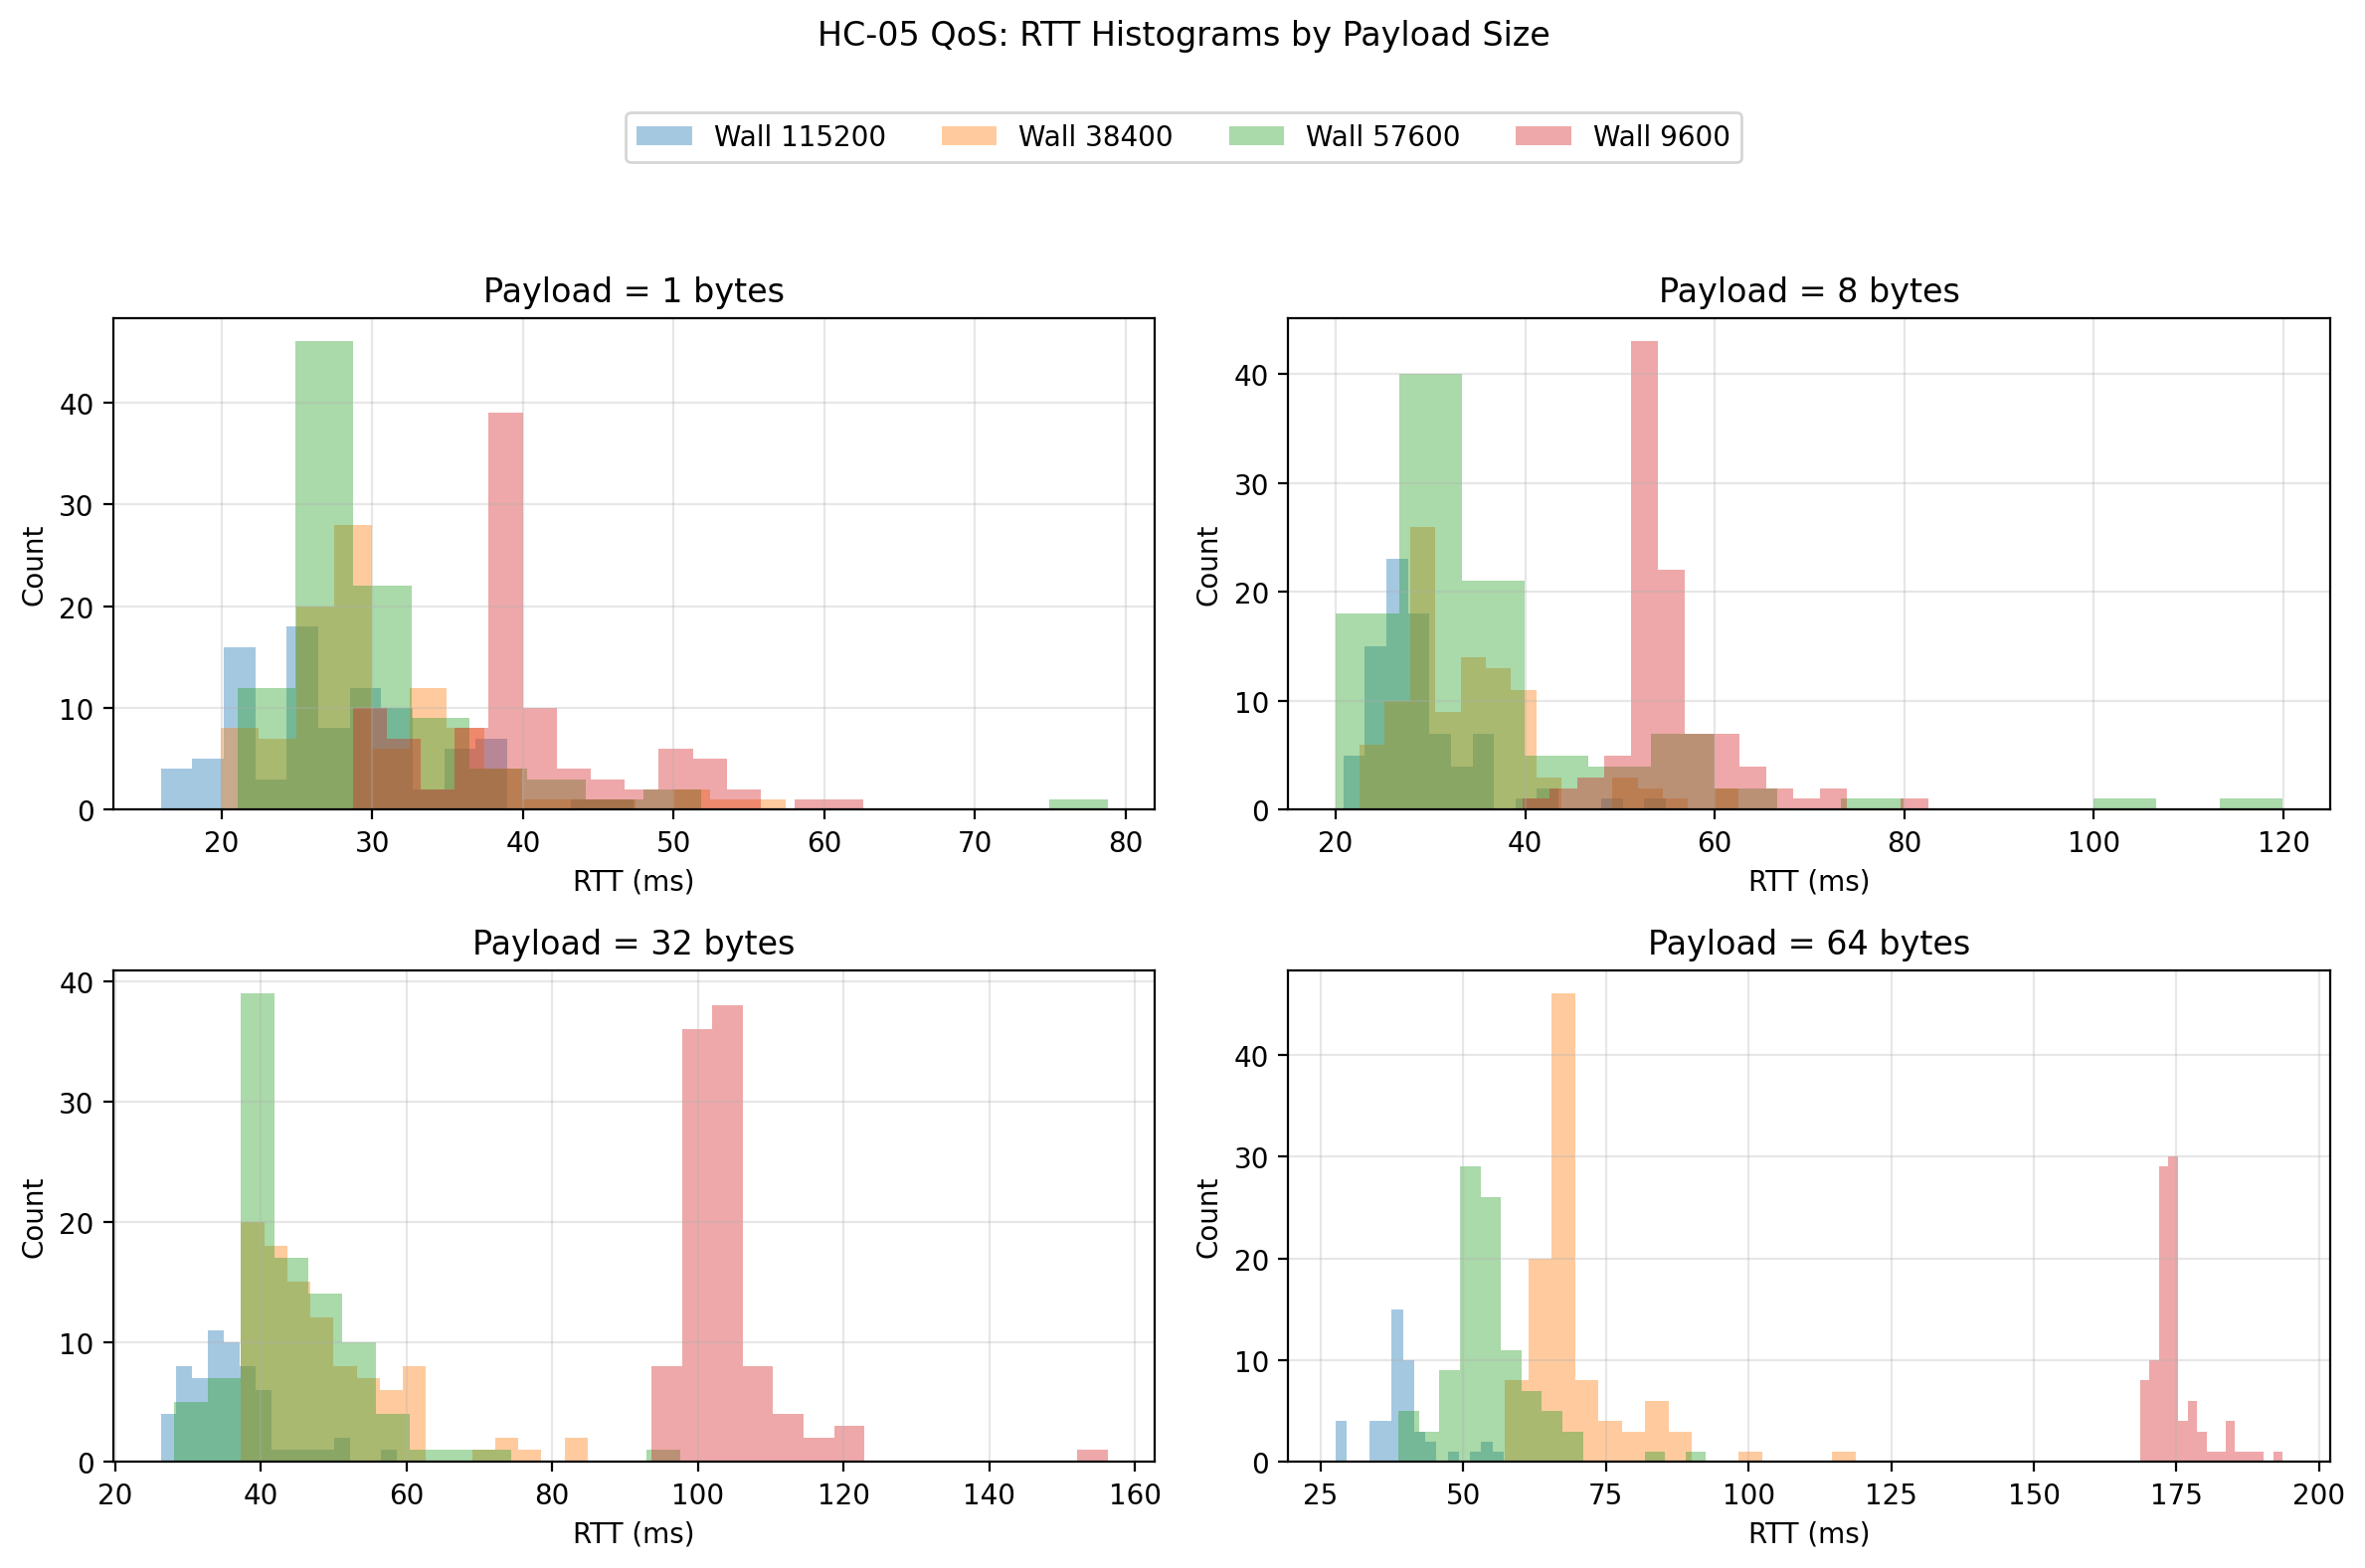
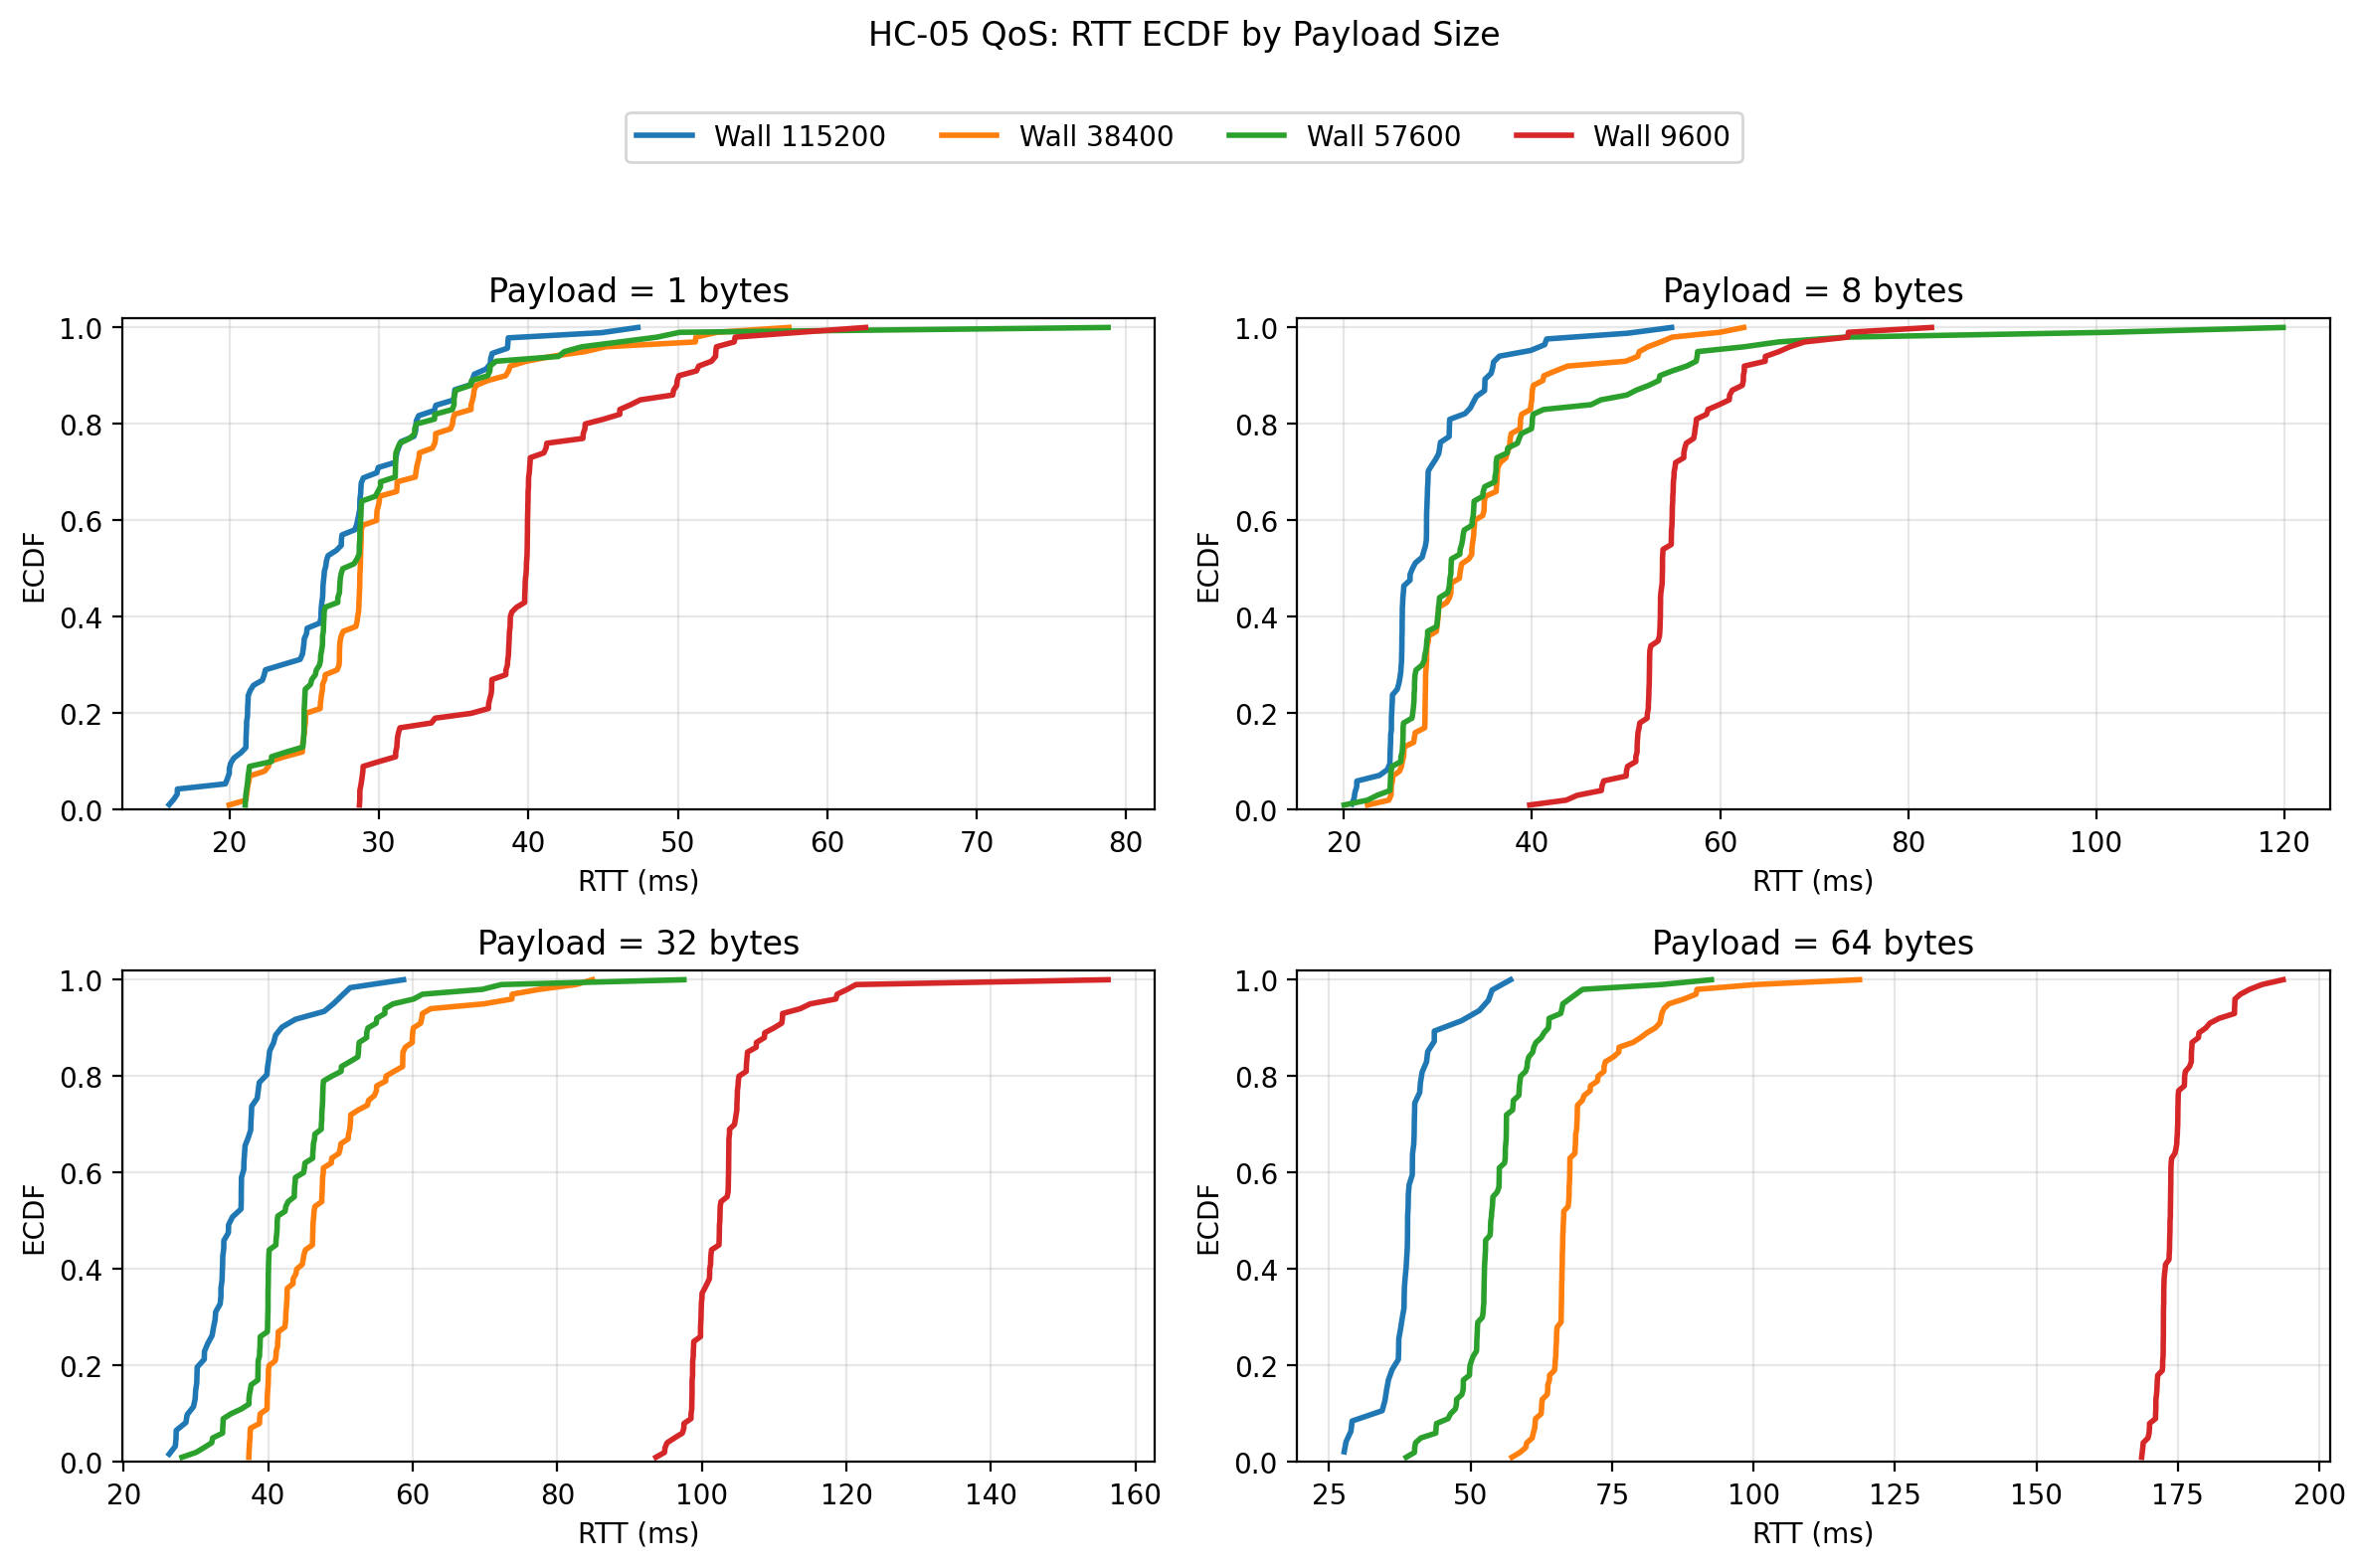
1 m: Raw-data plots
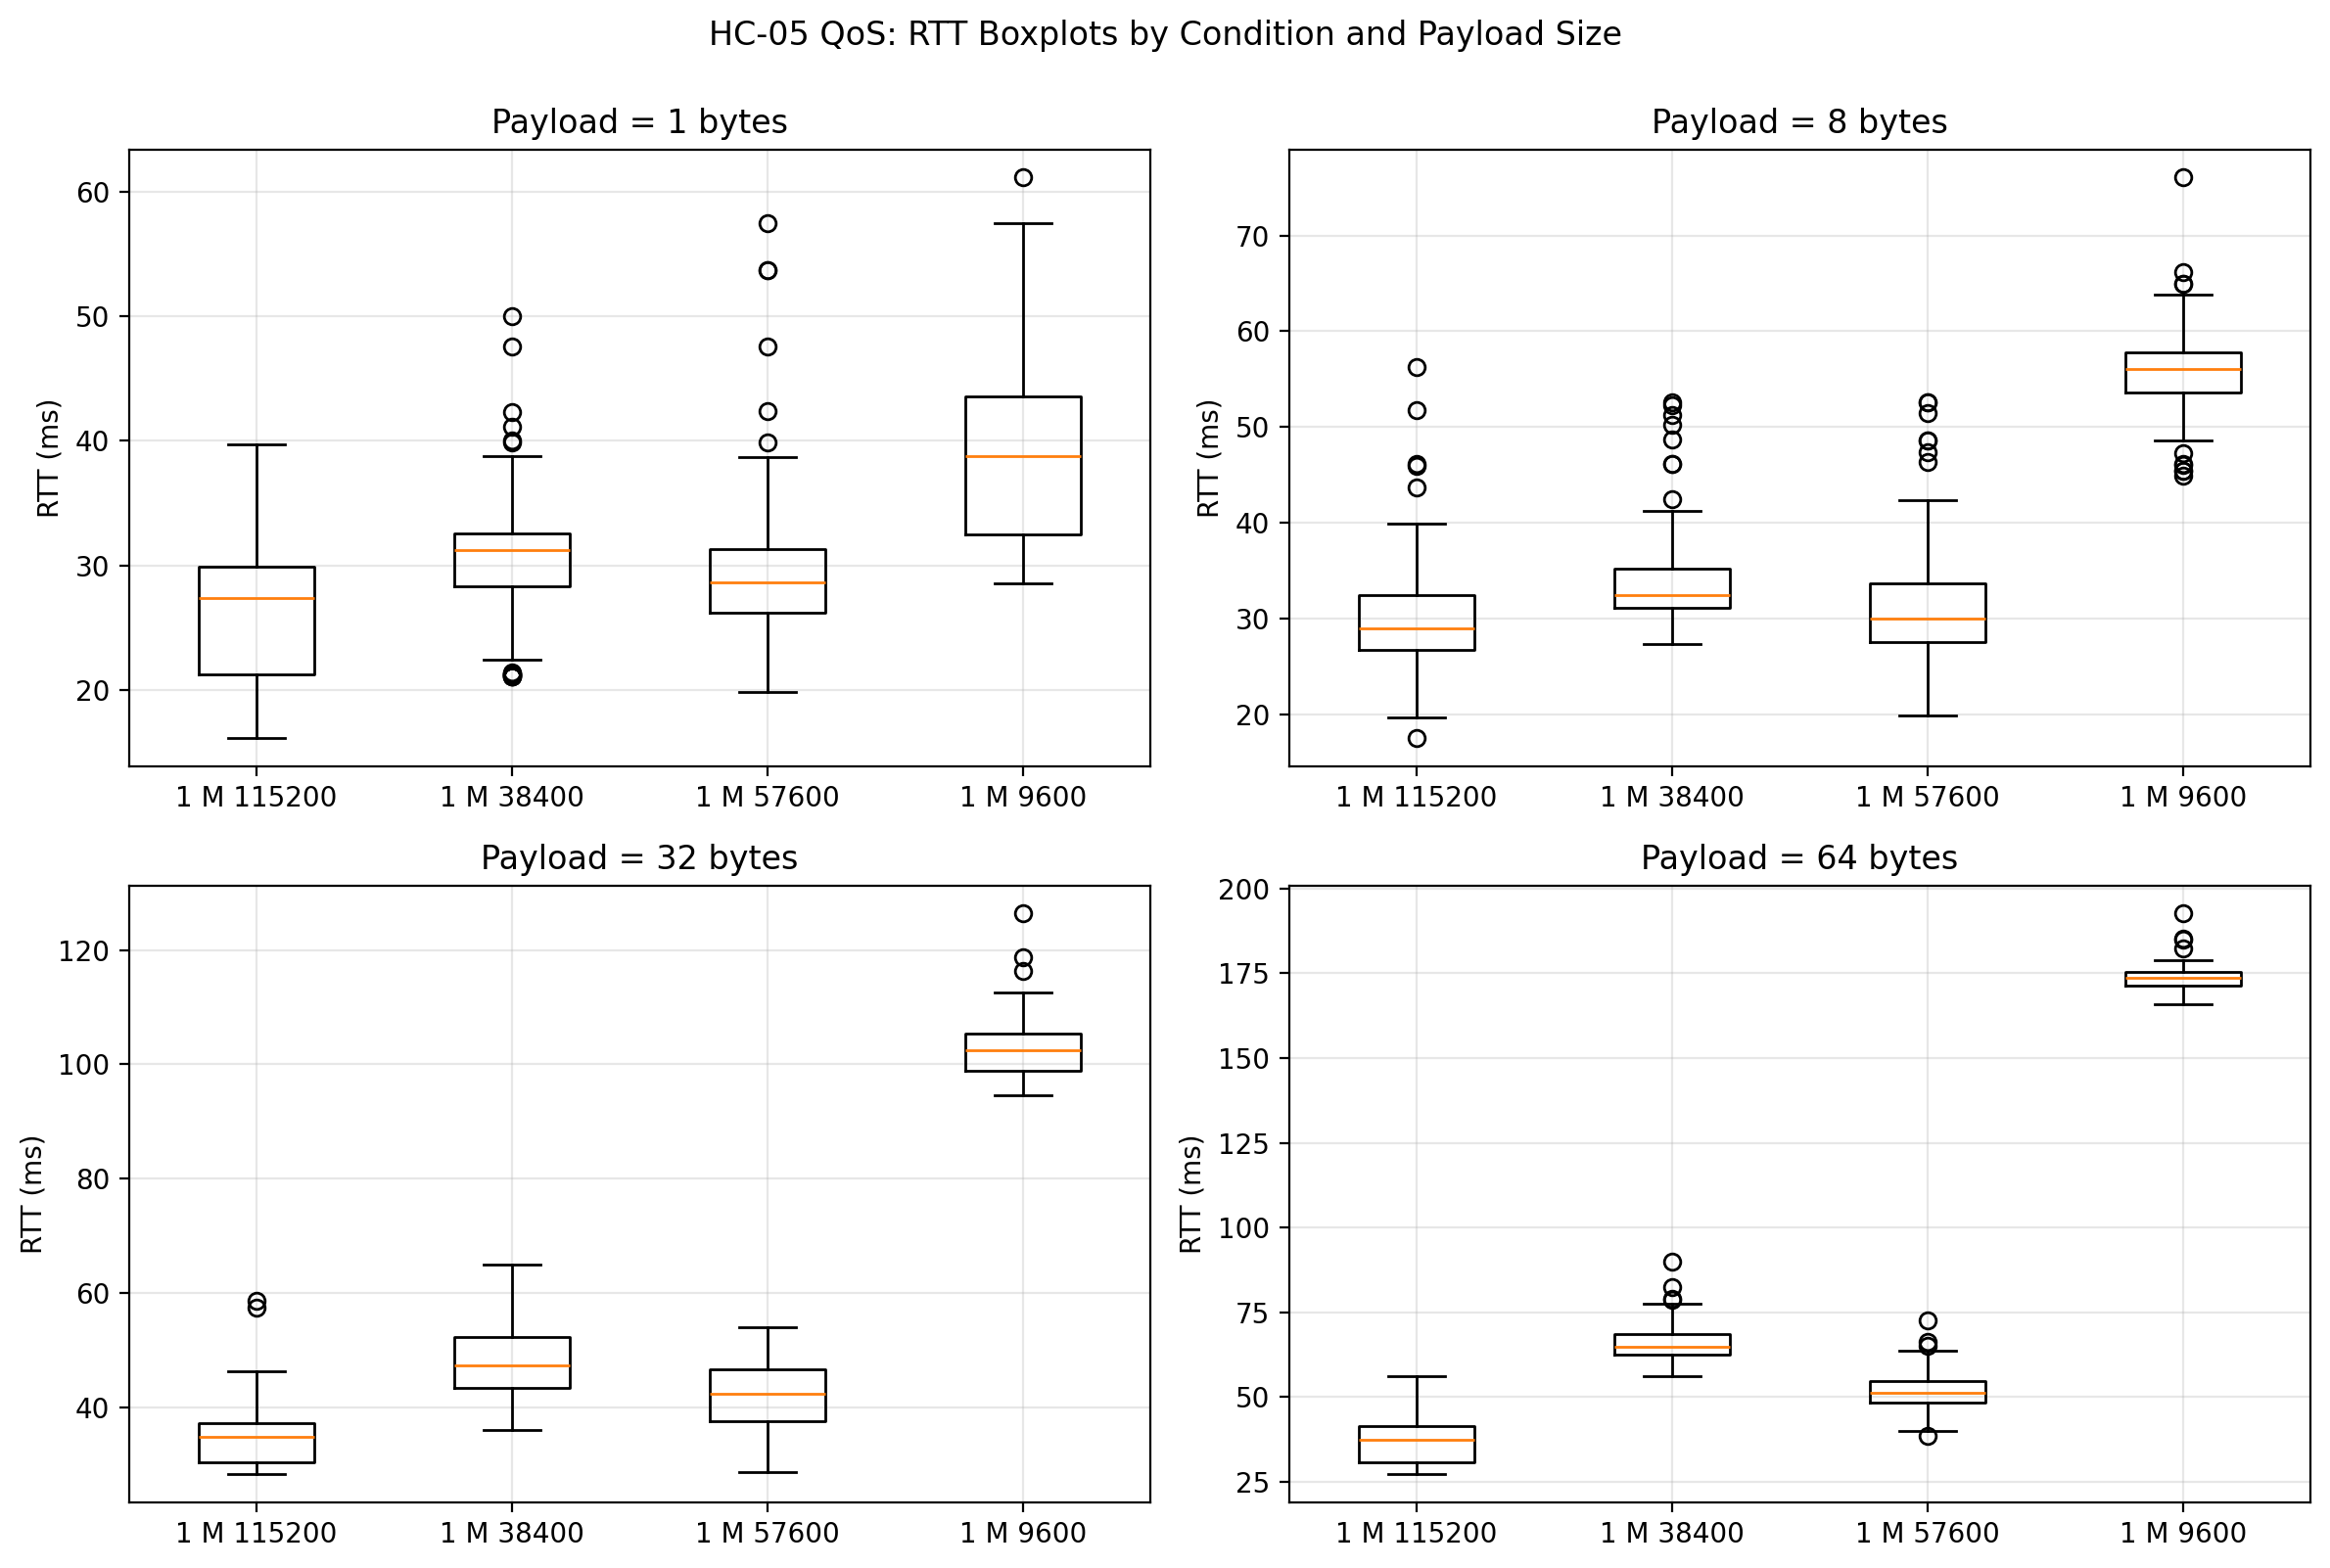
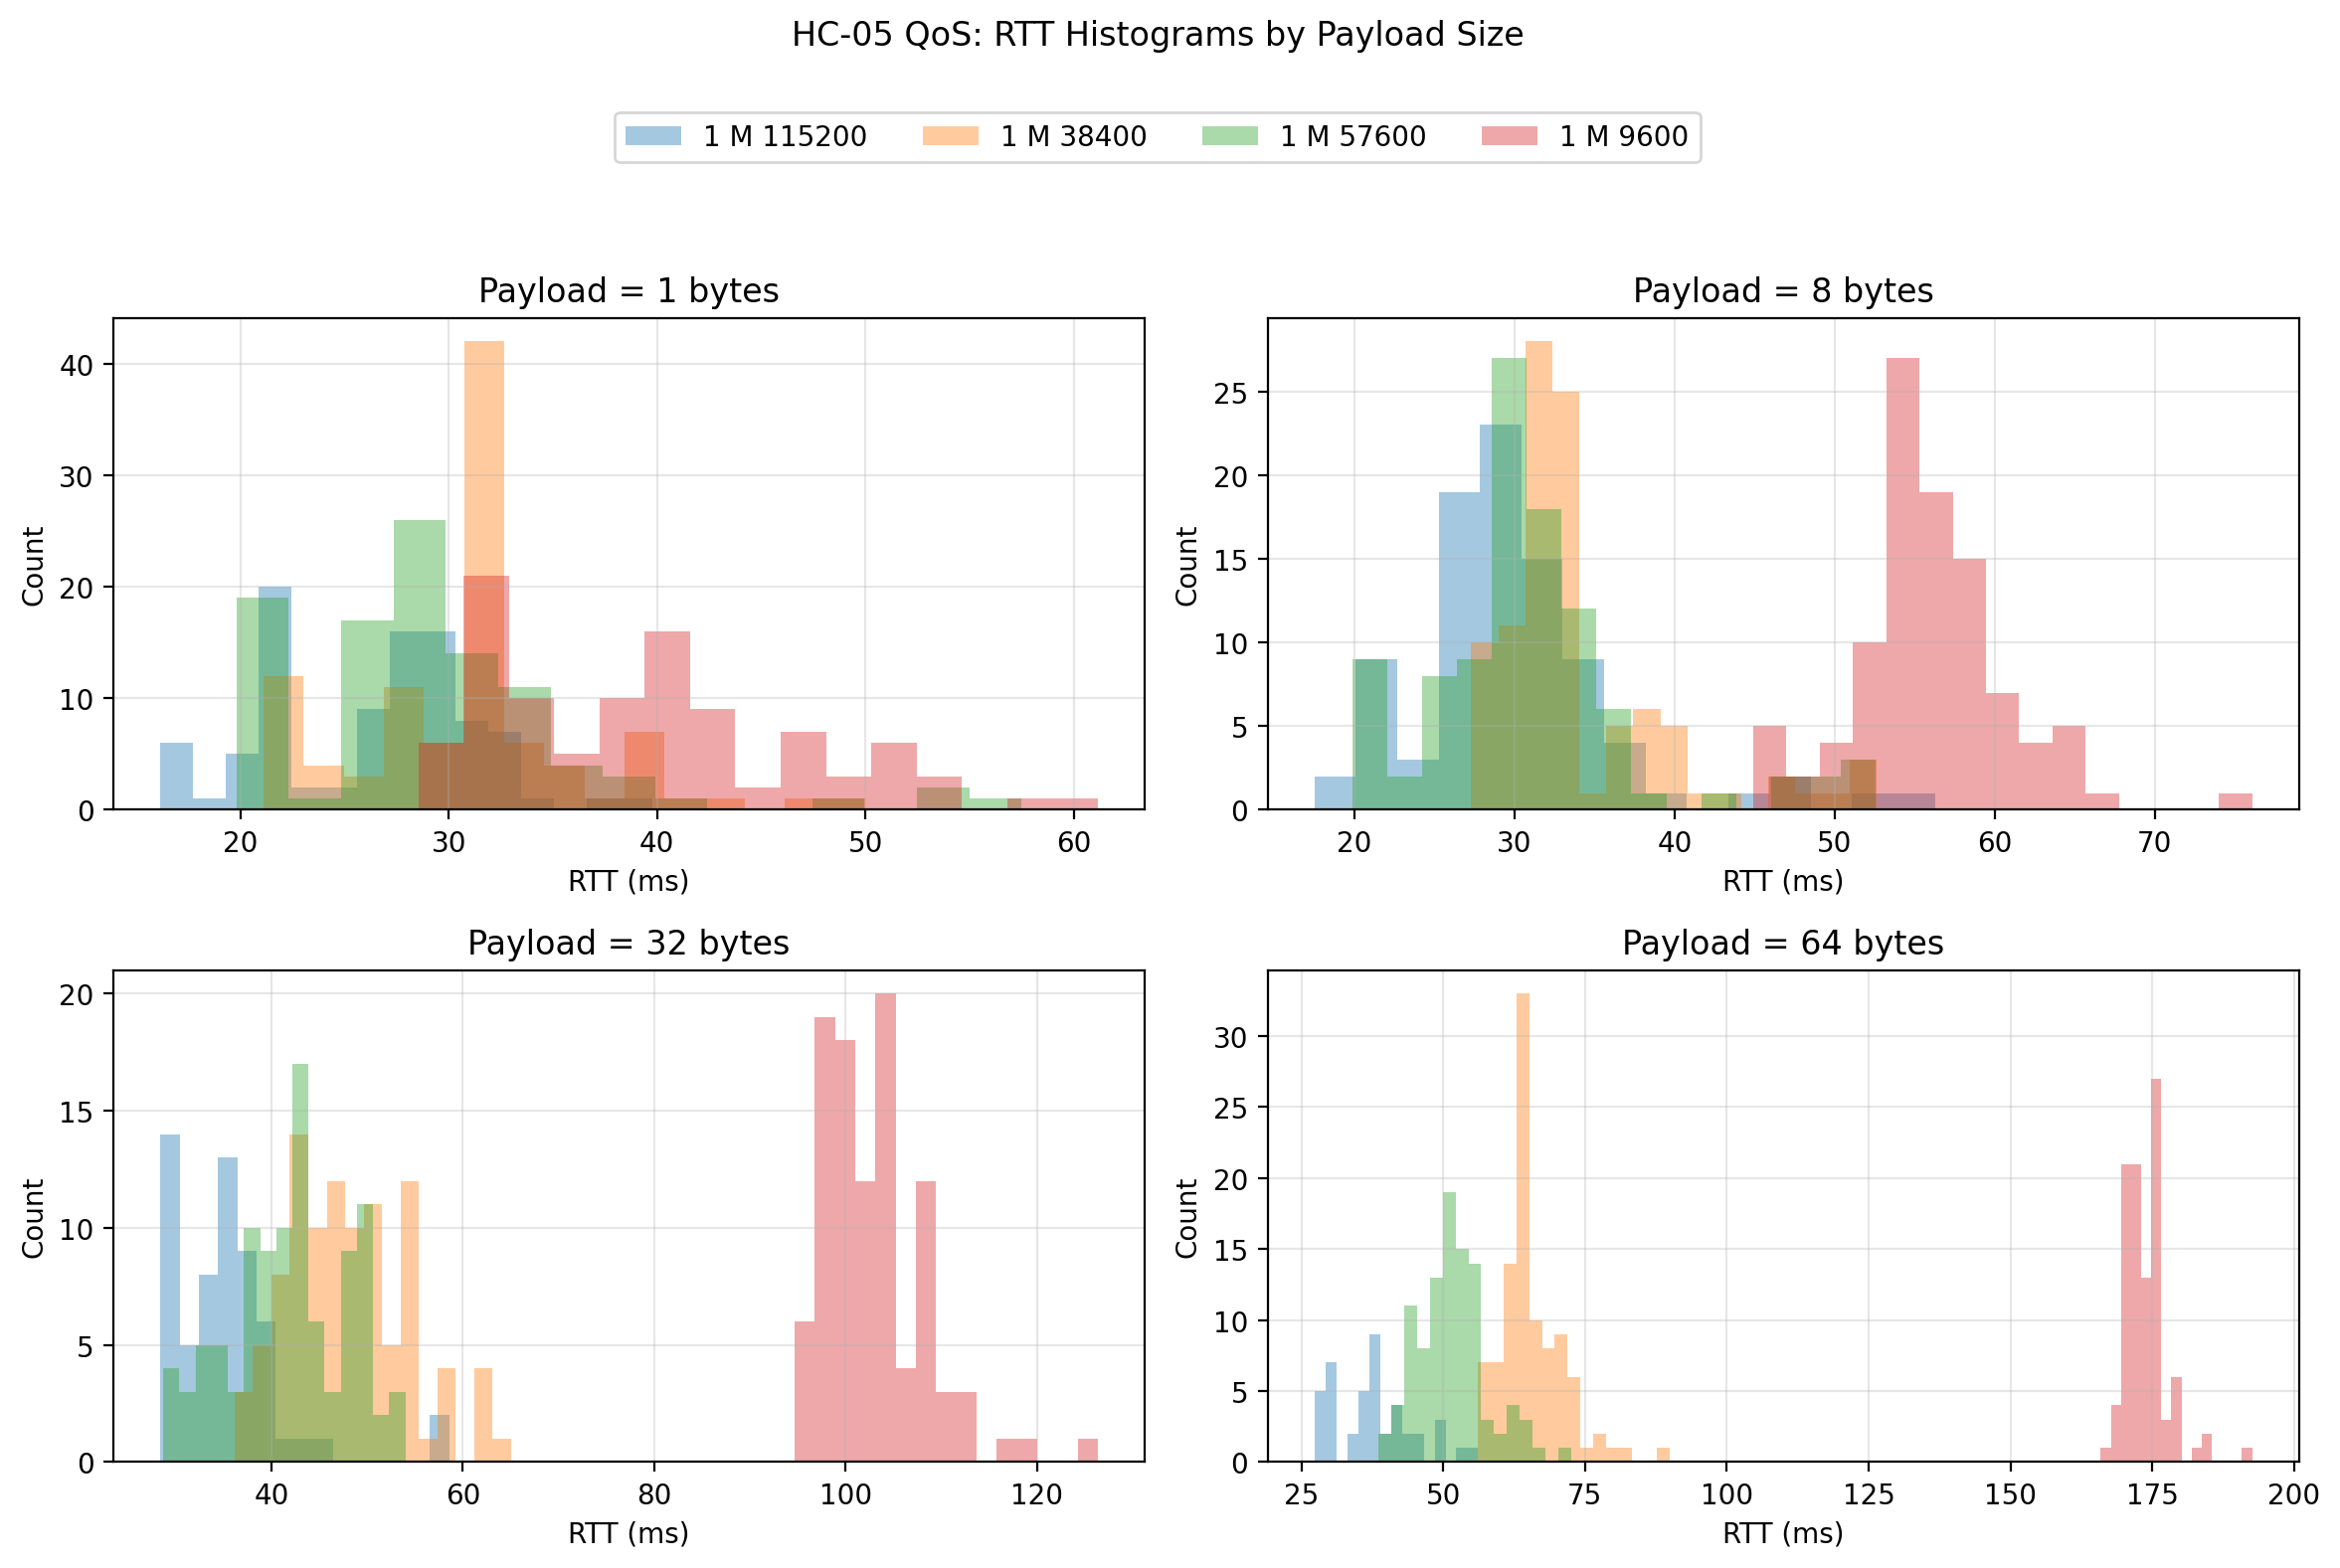
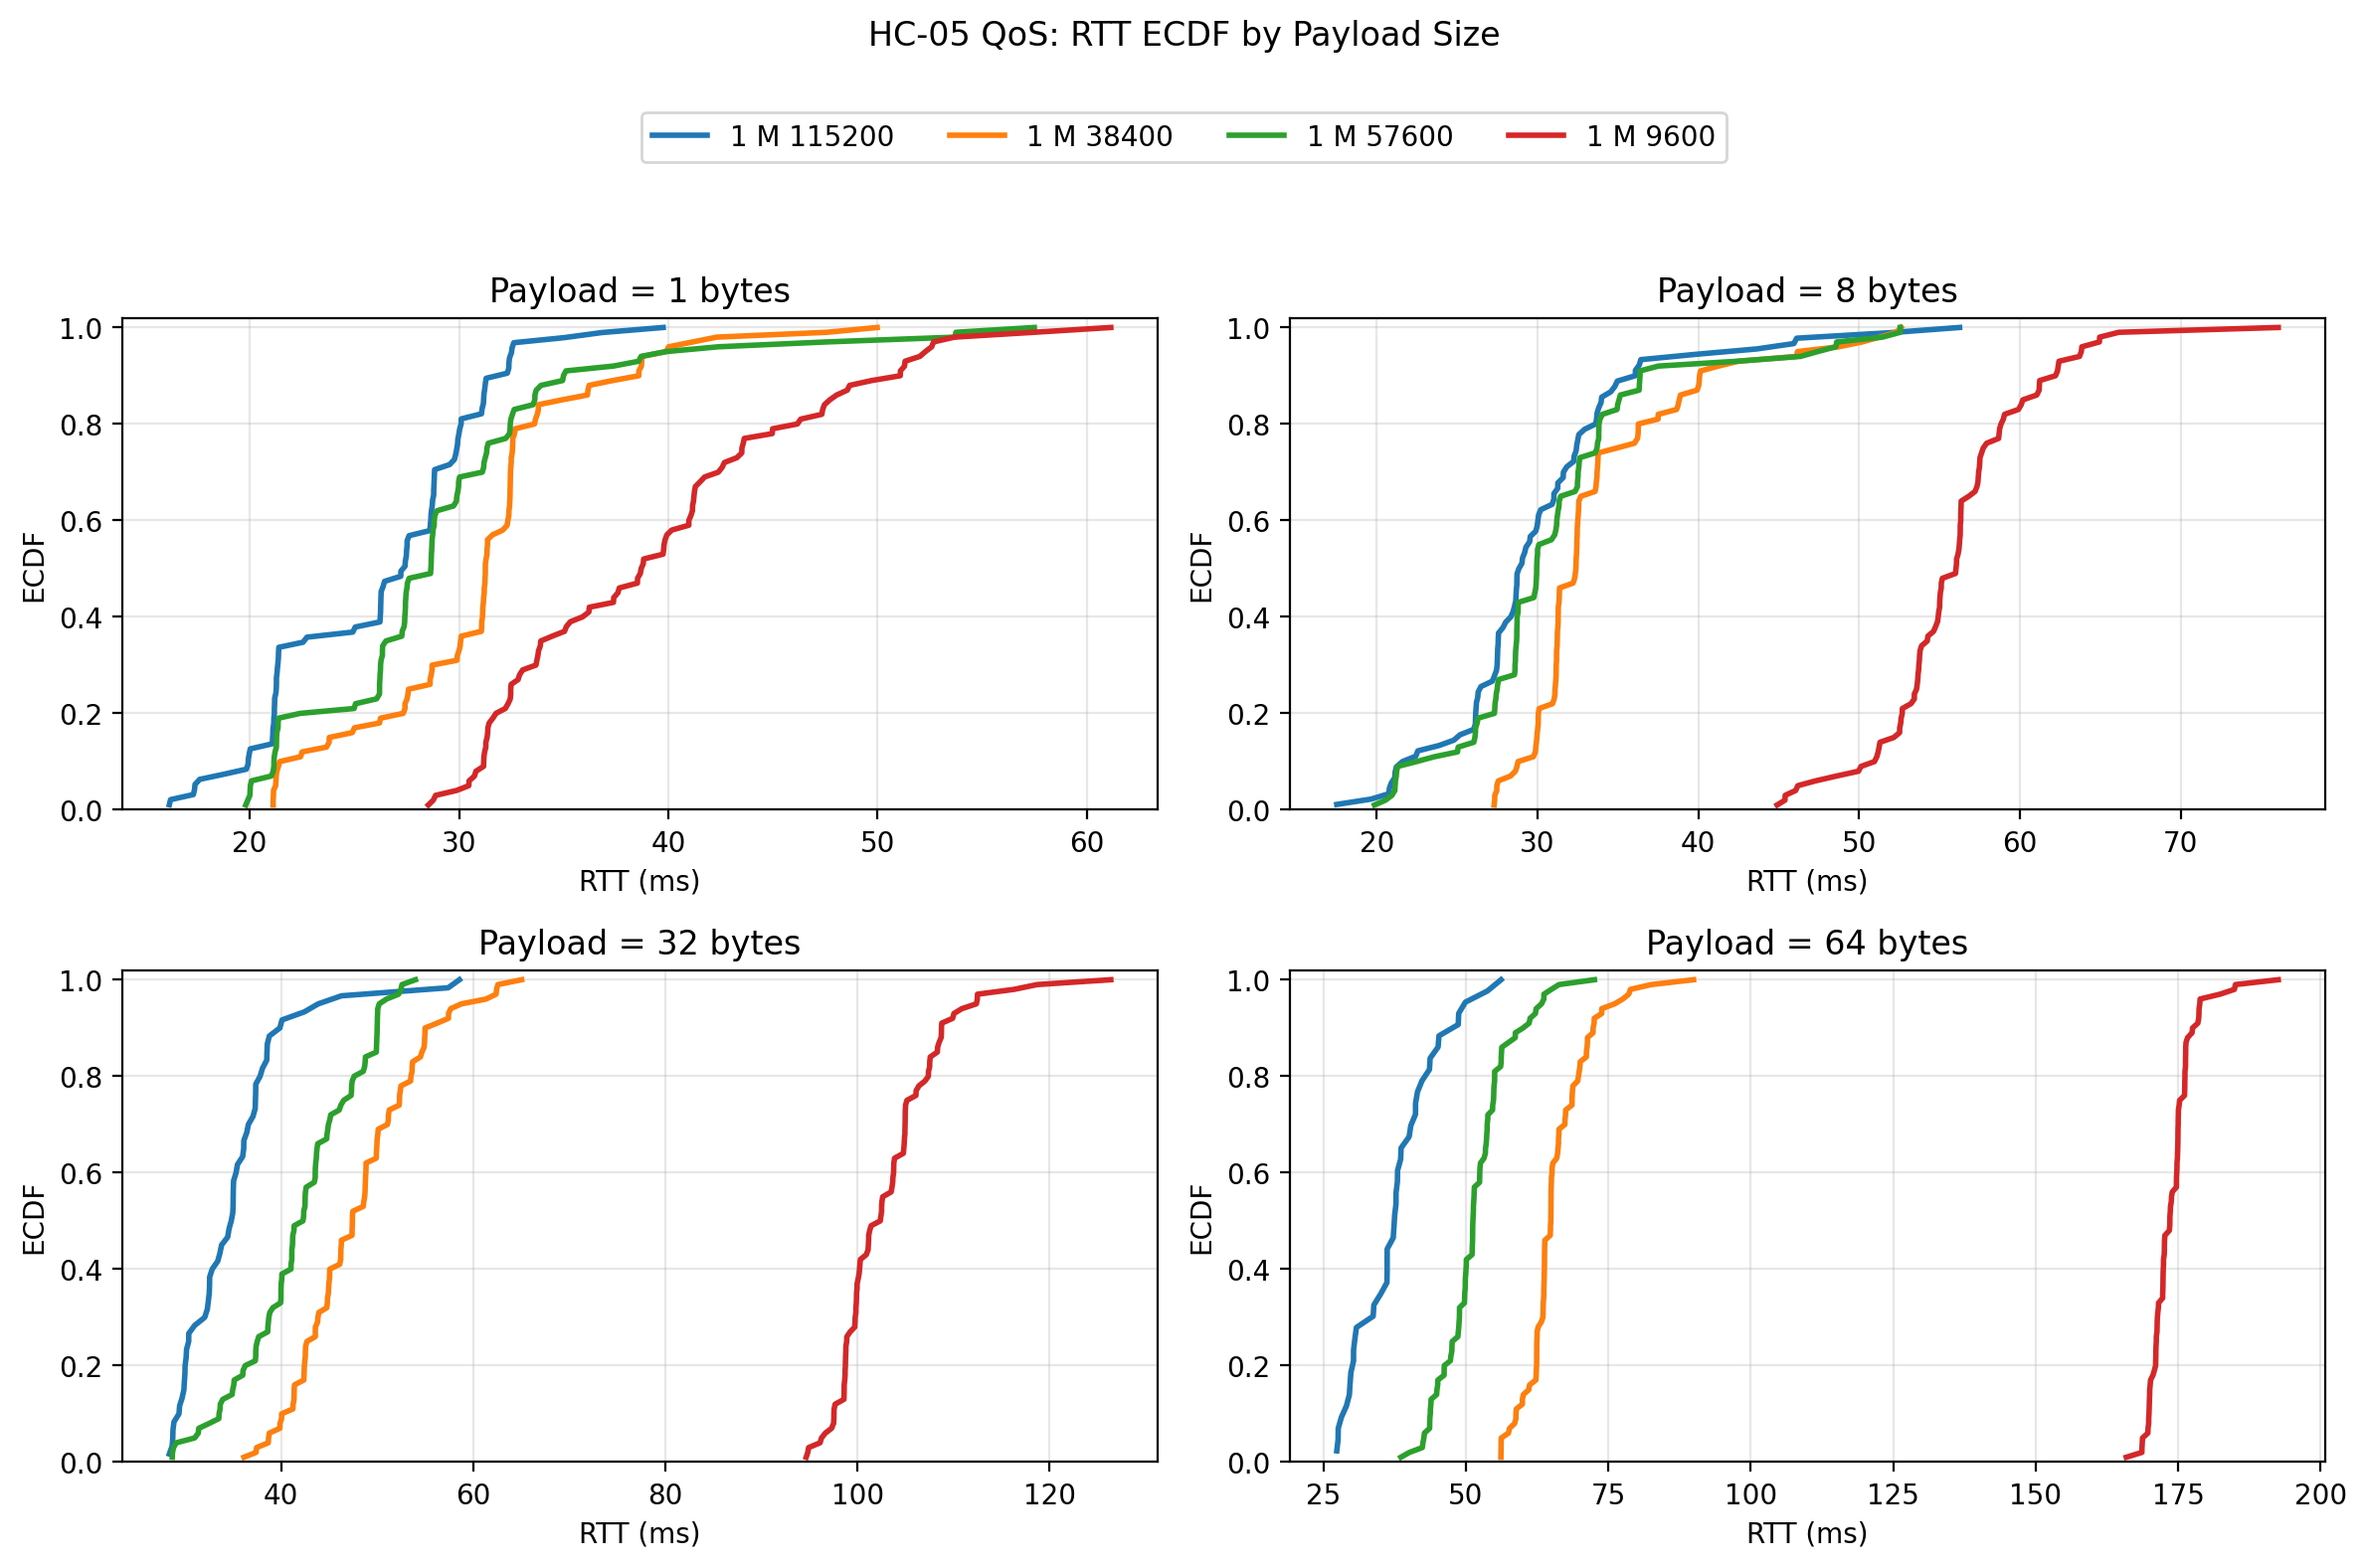
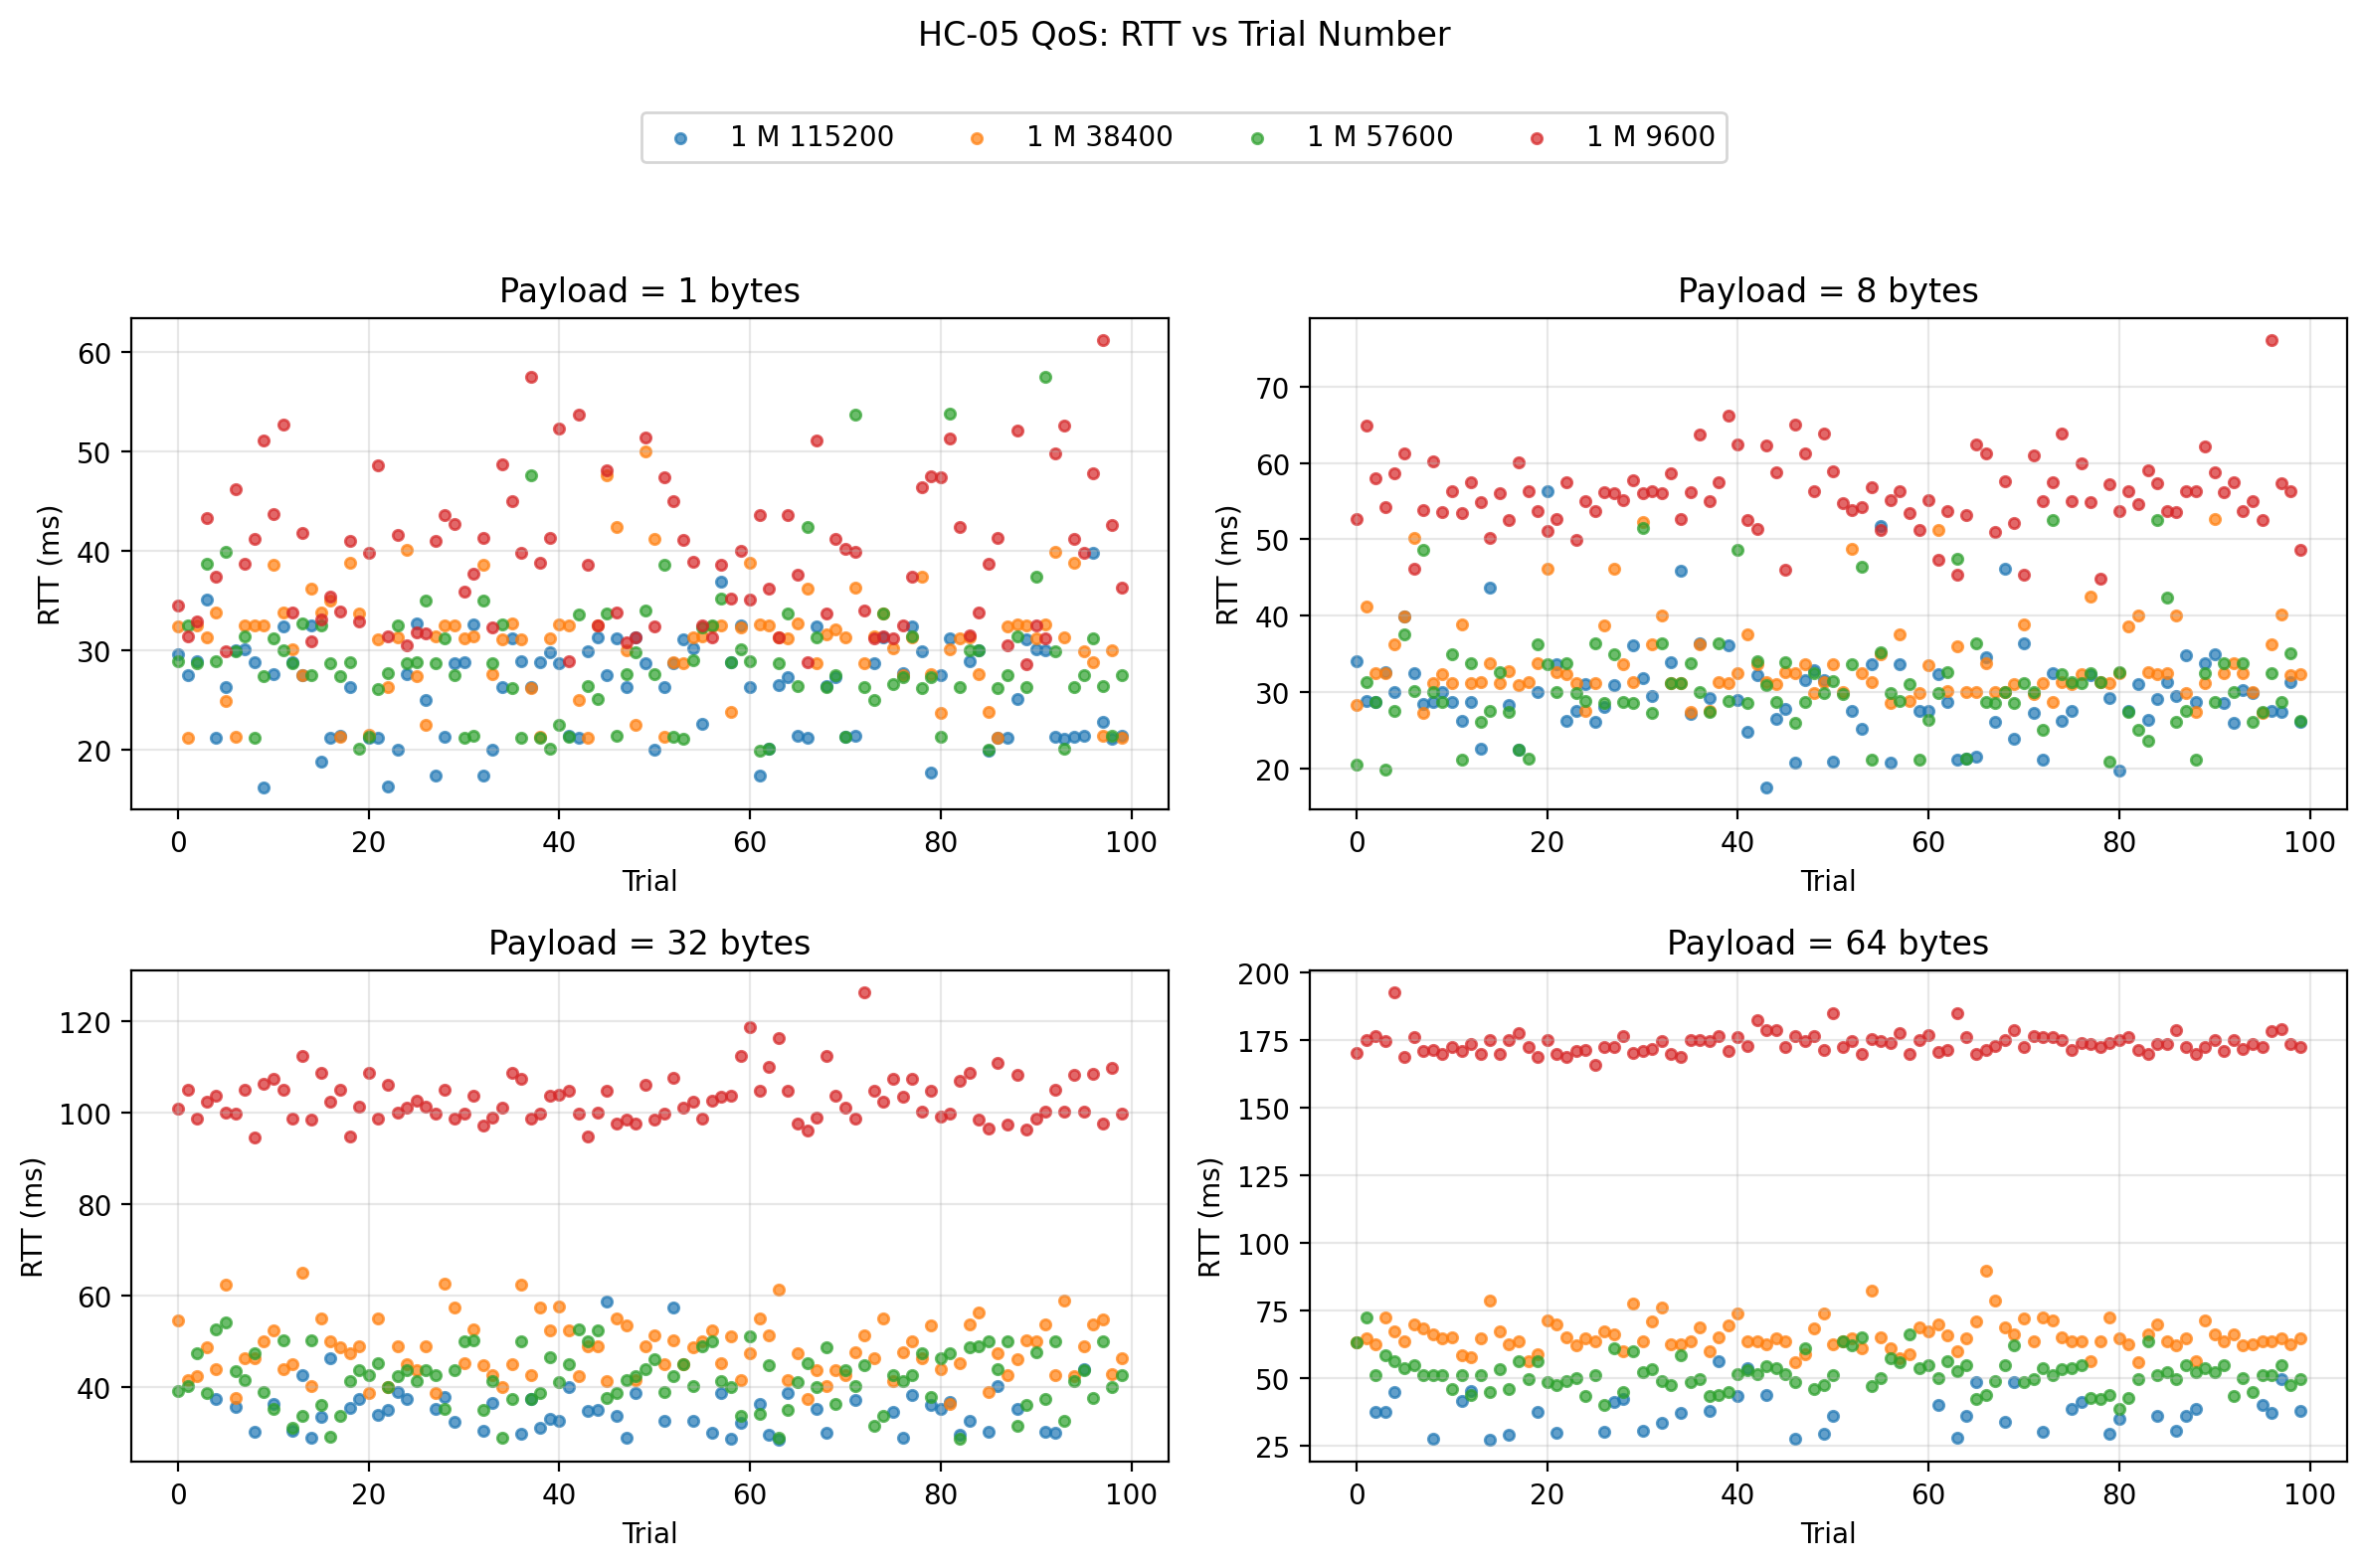
The raw-data plots confirm the summary interpretation. The boxplots and ECDFs show 57600 shifting the response distributions to lower RTTs than both 38400 and 9600, while staying compact. The scatter plot shows that the link remained fairly stationary over trial order and did not exhibit a strong warm-up drift. The histograms show that the stable rates preserve reasonably coherent distributions, while the problem at 115200 is not subtle distribution widening but outright failure to keep delivering valid packet returns.
3 m: Plots


At 3 m, the overall structure of the results stayed remarkably similar. 57600 again delivered the lowest RTT among the zero-loss configurations and the highest goodput. 38400 remained strong and fully reliable. 9600 remained completely reliable but substantially slower. 115200 still suffered large packet-loss penalties. One important observation is that moving from 1 m to 3 m did not fundamentally change the UART-rate ranking. That suggests the chosen UART rate had a larger effect on performance than the distance increase from 1 m to 3 m under these conditions.
The 3 m raw-data plots reinforce that interpretation:

The spread remains controlled for 38400 and 57600, and the distribution shift relative to 9600 remains obvious. In practical terms, 3 m did not expose a hidden instability in the zero-loss rates.
5 m: Plots
At 5 m, the stable rates remained surprisingly robust. 9600, 38400, and 57600 still completed with zero packet loss. That is a useful result in itself, because it means the distance increase to 5 m did not destabilize the stable UART rates in the same way that 115200 was destabilized by the serial-side rate increase.
The most interesting comparison at 5 m is between 38400 and 57600. 57600 still had the best mean RTT and the highest goodput, which keeps it in the lead overall. 38400, however, showed slightly tighter worst-case behavior for some of the larger payloads. In other words, 57600 remained the best choice if throughput and average latency were prioritized, but 38400 stayed competitive and very clean.
The raw-data plots at 5 m show this more clearly:
The shift from 9600 to 38400 and 57600 remains visually strong. The most important point is that the distance increase to 5 m still did not make 57600 collapse, while 115200 remained failure-prone in much the same way it had at shorter ranges. Again, that suggests the dominant issue at 115200 was not the radio path.
Wood wall: Plots
The wood-wall condition behaved much more like the shorter open-distance cases than like a severely degraded environment. 9600, 38400, and 57600 all remained at zero loss. 57600 still delivered the best overall combination of low RTT and high goodput, although the wall did increase variability somewhat at the larger payload sizes. 38400 remained fully viable and, in this condition, looked a little more conservative in exchange for somewhat lower efficiency.
The raw-data plots are consistent with that interpretation:
The wall adds some spread, but it does not fundamentally change the ranking of the usable UART rates. That is an important result, because it suggests that under the tested indoor household condition, UART rate remained the stronger performance driver than the wall itself.
Cross-condition interpretation
The broadest finding from the study is that UART rate mattered more than distance or the light wood-wall obstacle, at least once the rates were limited to the stable region.
Moving from 9600 to 38400 produced a dramatic reduction in RTT and a large increase in goodput, while maintaining zero packet loss in every tested environment. Moving from 38400 to 57600 produced another meaningful improvement and still preserved zero packet loss in every tested environment. In contrast, moving from 57600 to 115200 did not produce a usable improvement. Instead, it pushed the system into a regime where packet loss rose sharply with payload size.
That last result is the most revealing. If this had been an HC-05-only study, it might have been tempting to expect 115200 to be the best setting. But this was a system-level benchmark, and at the system level 115200 was not viable. The most likely explanation is not the Bluetooth radio itself, but the local serial implementation—particularly SoftwareSerial on the Uno—becoming the limiting factor.
A second important finding is that distance and the wood wall did matter, but less than I initially expected for the stable rates. Once the platform was operating at 9600, 38400, or 57600, the performance ranking stayed broadly intact across 1 m, 3 m, 5 m, and the wood wall condition. That suggests the selected UART rate was the first-order design choice, while the tested environmental differences were second-order stressors.
Engineering conclusion
If I had to choose one UART rate for this HC-05 + Elegoo Uno R3 platform after this study, I would choose 57600.
It delivered:
- zero packet loss in all tested environments,
- the lowest mean RTT among the zero-loss rates,
- the highest goodput among the zero-loss rates,
- and an acceptable jitter profile.
If I wanted a more conservative choice with slightly less aggressive timing, I would choose 38400. It was also fully reliable and still much better than 9600.
I would not choose 9600 unless compatibility or simplicity were more important than performance.
I would not choose 115200 for this Uno-based SoftwareSerial design, because the effective system performance became poor once packet loss was taken seriously.
That is the key lesson of the post: the best nominal UART rate is not the best system rate. The best system rate is the one that gives the best combination of latency, stability, reliability, and throughput in the actual hardware and firmware stack being used.
What I would do next
The most useful next step would be to repeat the same experiment on a board with a stronger serial implementation, such as one using a hardware UART that can comfortably sustain high rates. That would make it possible to separate the HC-05 module’s limits from the Uno SoftwareSerial limits much more cleanly.
A second useful next step would be to test repeated runs per condition so that the stability of the conclusions themselves can be quantified, not just the packet timings.
A third extension would be to introduce streaming or burst traffic rather than stop-and-wait, but only after preserving this stop-and-wait benchmark as the clean baseline reference.
Final reflection
This experiment ended up being far more informative than a simple “higher baud is faster” test. It showed that UART-rate changes can improve a Bluetooth telemetry link dramatically, but only up to the point where the rest of the platform can still keep up. It also reinforced an idea that has come up repeatedly in this project: meaningful communication benchmarking has to be done at the system level.
The HC-05 did not exist in isolation. It was part of a path that included the Bluetooth host session, a serial bridge, a voltage-shifted UART leg, a software UART implementation on an 8-bit microcontroller, and host-side packet timing and validation. That is what the benchmark measured, and that is why the result is useful.